Summary
/-/https/www.sciencebuddies.org/cdn/Files/15558/6/domino-setup-23-immune-thumbnail.jpg)
/-/https/i.ytimg.com/vi/hZ6IJOLaIyI/maxresdefault.jpg)
Introduction
Have you ever wondered why you need to get a flu shot regularly? The vaccine protects you from getting sick with the flu, which is an infectious disease. Such diseases, like the flu or COVID-19, can easily spread through a population and cause a pandemic by making many people sick. Measures such as social distancing can reduce the risk of catching the disease, but real protection only comes from gaining immunity against the disease. This is the reason for vaccinations—to make someone immune to a specific disease. In this activity, you will find out how immunizations can limit the spread of an infectious disease up to a point where the whole population is protected through herd immunity.
Materials
- Printer
- Paper
- Dominoes or small wooden rectangles (about 30)
- Double-sided tape
- Red and green stickers (if you are using dominoes)
- Pencil or pen
- Optional: Printed Herd Immunity Template (at least 2)
- Optional: Colored pencils or markers (red and green)

/-/https/www.sciencebuddies.org/cdn/Files/15559/6/materials-herd-immunity-activity.jpg)
Prep Work
- Print out the Domino Template.
- Optional: Print out at least two copies of the Herd Immunity Template.
- Find a workspace that has a flat surface, such as a table or the ground.
Instructions
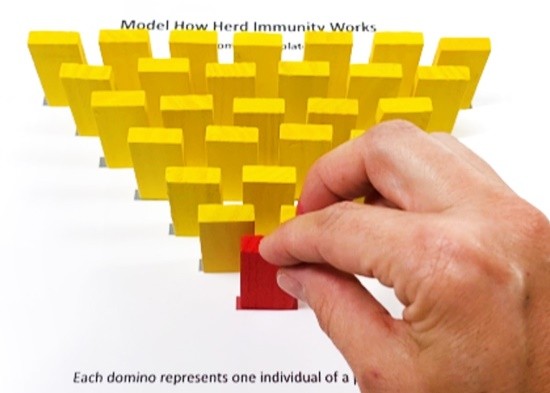
- First you will visualize the spread of an infectious disease through a community using a domino model. Set up your dominoes, as shown in the Domino Template. Do not worry about the green colors at this point. If you have a wooden red rectangle, use it for the final one (colored "red" in the template), or mark a regular domino with a red sticker.
 What do you think the dominoes represent? What do you think the red domino represents?
- Now model how the infected person (the red domino) spreads the disease through the rest of the population. Knock over the red domino into the direction of the other dominoes.What happens to the other dominoes?
- Count how many dominoes are still standing. In the model, every domino that fell represents another infected person.How many people got infected from the one initial infected person? How many weren't infected?
- In the next step, you will model how people who got immunized, either through vaccinations or having been exposed to the disease, affect the spread of an infectious disease. Set up your dominoes again, as shown in the Domino Template. This time, you will use one green wooden rectangle (or mark a domino with a green sticker) to represent an immunized person. Use double-sided tape to tape the green domino labeled "1" to the template. Make sure it sticks to the ground and does not fall over when knocked. Again, place the red domino at the tip of the domino triangle.

- Knock the red domino over again to model how the one infected person spreads the disease through the population.What do you observe this time? Did all the dominoes fall? What effect did the one immunized person in the population have?
- Next, repeat the simulation, but this time, add two immunized persons to your community. Tape two green dominoes (labeled "1" and "2" on the template) to the template.How many people got infected? How many people stayed healthy?
- Finally, run the simulation again, but this time add the third immunized person to your community. Tape three green dominoes to the ground as shown on the template.Did more or fewer people get infected compared to the previous simulation? Can you see a trend with increasing numbers of immunized people in a population?
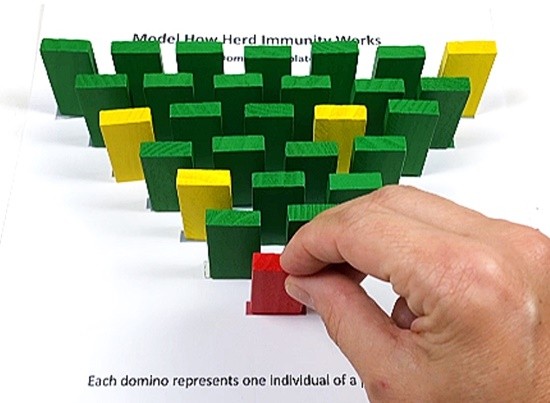
- Herd immunity means that a certain number of people in a population need to be immune to a disease to stop its spread and protect the remaining vulnerable individuals. For example, the estimated herd immunity threshold of COVID-19 is between 75–89%, which means that for every 100 people, 75–89 need to be immune.If 80% of the population (or 4 out of every 5 people) has to be immune against COVID-19, how many vaccinated individuals (green dominoes taped to the ground) do you need in the domino template (28 dominoes in total)?
- Set up the dominoes again and tape as many green dominoes to the template as you calculated you would need to represent 80%. Pick them randomly from the population. Keep the red domino at the tip of the triangle. Then start the simulation by knocking over the red domino.How many people got infected? How many vulnerable people were protected from the disease by immunized people?
- The following part of this activity is optional. The domino simulation only accounts for spreading the disease from one infected individual in one direction. In the next step, you will use the Herd Immunity Template to model the spread of the disease in all four directions.
- In the template, pick three random circles and color them red. Mark these initial three circles with an X. The red circles will represent infected individuals. The first simulation will be without any immunized people. Color each circle that is adjacent (directly below, above, or diagonal) to a red circle red as well. Then color each circle that is adjacent to a new red circle red and continue to do so.If no one in the population is immune to the disease, how many of the initial 50 individuals are infected at the end?
- In the next step, use a fresh Herd Immunity Template and color the same three circles red (they are the ones you marked with an X in the previous Herd Immunity Template). Then add five immunized individuals to the population by coloring five random circles green.
- Again, color each uncolored circle that is adjacent to a red circle red and continue spreading the disease from circle to circle.How many circles end up being red this time?
- Using a fresh Herd Immunity Template, increase the number of immunized individuals in the population and start with the same three infected people.How many individuals still get infected if you immunize 90% of the population (9 out of every 10)? Can you now see how herd immunity protects vulnerable individuals in a population from getting infected?
/-/https/www.sciencebuddies.org/cdn/Files/15560/6/domino-setup-herd-immunity.jpg)
/-/https/www.sciencebuddies.org/cdn/Files/15561/6/domino-setup-one-immune.jpg)
/-/https/www.sciencebuddies.org/cdn/Files/15562/8/domino-setup-23-herd-immune.jpg)
Cleanup
What Happened?
When you set up the dominoes, each individual domino represented a person within a population. In the beginning, no one is immune to the disease, so if one infected person (the red domino) introduces an infectious disease, everyone else who is in close contact with the infected person will get infected as well. You should have noticed that all the dominoes fell when you knocked over the red domino in your first simulation, which means that all other individuals got infected with the disease. However, if a person gets immune to the disease, this person will not get infected.
When you modeled an immune individual by taping a domino to the ground, you should have noticed that it did not fall over, which means that person did not get infected. The green domino also acted as a shield to protect the other dominoes behind it. As a result, some of the dominoes that were behind the taped domino (immune person) might have stayed upright. These people were protected by the immunity of the one person. When you increased the number of immune individuals in a population, you should have noticed that more and more people were protected from the disease, meaning that the dominoes did not fall over. When simulating a herd immunity threshold of 80%, you should have taped 23 (rounded up from 22.4) dominoes to the ground (28 x 0.8 = 22.4). During that simulation, you should have noticed that very few people got infected (or very few dominoes fell). If you immunize enough people, eventually the whole population will be protected through herd immunity.
If you did the activity with the herd immunity template, you should have made similar observations. Without any immunity in the population, the infectious disease spreads until everyone is infected. When you added more and more immune individuals to the group, you should have noticed that fewer and fewer people in the population got infected in your model.
Digging Deeper
Infectious diseases, such as COVID-19, the flu, or measles, are usually caused by either bacteria, viruses, or fungi, and easily spread from one person to another either directly or indirectly. The spread often happens through close person-to-person contact, including through droplets people emit when they cough or sneeze. This means that you are at the highest risk for catching the disease through daily contact with other people, like shaking hands with a sick person or sitting next to a coughing person on the bus. Once you are infected, you, in turn, can spread it to others, even if you do not have any symptoms of the disease (also known as asymptomatic).
To predict how fast a specific infectious disease spreads through a community or population, it is important to know how contagious it is. Epidemiologists use the basic reproduction number (R₀), pronounced "R naught," as an indicator of the transmissibility of an infectious disease. R₀ is a measure of how easily a disease spreads from person to person and represents the number of new infections estimated to be caused by one single infected person. An R₀ of 4, for example, means that one infected person on average infects 4 more people in a population. This means that the higher the R₀ for a disease is, the more contagious it is. R₀ numbers are usually estimated from mathematical models and are affected by biological, environmental, and behavioral factors. Some R₀ values of well-known infectious diseases are shown in Table 1.
| Infectious Disease | R₀ value |
|---|---|
| Measles | 12–18 |
| Chickenpox | 10–12 |
| HIV (AIDS) | 2–5 |
| Influenza (flu) | 0.9–2.1 |
| Ebola | 1.5–1.9 |
| SARS-CoV-2 (COVID-19) | 2–6 |
Source: Basic reproduction number, Wikipedia, July 21, 2020
Once there is an outbreak of an infectious disease, the goal is always to limit the spread of the disease to protect as many people in a population as possible, which means lowering the R₀ value below 1. There are several ways to decrease the R₀ value of an infectious disease. Because you cannot change the biology of the virus or bacteria, an alternative and effective way is to change people's behaviors. One example is social distancing, which means limiting contact to other people as much as possible; for example, by closing schools and businesses, avoiding large crowds, or staying at least 6 feet away from others in public places. Another possibility is increasing people's immunity to the infectious disease. Immunity to a disease means that you are protected from an infection. It is achieved through the presence of antibodies to that disease in a person's system, which are able to fight off the disease-carrying organisms. These antibodies can either be produced by your body when you are exposed to the disease organism or if you get vaccinated. During vaccination, a killed or weakened form of the disease organism is introduced into a person's body, which triggers an immune response and the production of disease-specific antibodies without you getting sick.
In reality, however, vaccination is unlikely to result in immunity to a disease in the whole population. This is because some people cannot become immune because of medical conditions or decide not to get vaccinated. These people need to be protected from an infectious disease indirectly. One way to achieve protection for the whole population is by herd immunity. Herd immunity occurs when a large percentage of a population has become immune to an infection through vaccination or previous infection. If enough people are immune to a disease, they can protect individuals who are not immune. For example, if someone with chickenpox is surrounded by people who are immune to chickenpox, the disease will not pass on to anyone and will quickly disappear again. Figure 1 shows how herd immunity can protect people who are at-risk in a population.
/-/https/www.sciencebuddies.org/cdn/Files/15565/6/herd-immunity-schematic.jpg)
When a critical portion of a community is immunized against a contagious disease, most members of the community are protected against that disease. This is known as community (or 'herd') immunity. The principle of community immunity applies to control of a variety of contagious diseases, including influenza, measles, mumps, rotavirus, and pneumococcal disease. The top box depicts a community in which no one is immunized and an outbreak occurs. In the middle box, some of the population is immunized but not enough to confer community immunity. In the bottom box, a critical portion of the population is immunized, protecting most community members.
Figure 1. Schematic diagram illustrating the concept of herd immunity. When a critical portion of a community is immunized against a contagious disease, most members of the community are protected against that disease. Source: "Community Immunity," National Institutes of Health, Wikimedia Commons, 2013.
The herd immunity threshold, or the percentage of people who have to be immunized in a population to prevent the spread of a disease, is dependent on how contagious the disease is. This is why the basic reproduction number R₀ can be used to estimate the proportion of the population (P) that must be vaccinated to stop the spread of a disease through a population. The equation to calculate the herd immunity threshold is given below.
For example, if the R₀ for a disease is 5 (R₀ = 5), then P (the proportion of the immune population) must be at least (1-1/5) = 0.8. That means that 80% of the population must be immune either through vaccination or previous infection.
Ask an Expert
For Further Exploration
- Continue repeating the simulations, using either the Domino Template or the Herd Immunity Template. In each simulation you can change the number of infected individuals, as well as the number of immunized individuals. How do your results change each time?
- Model different vaccination and herd immunity scenarios using the interactive game VAX!.
- Do more research on infectious diseases, such as COVID-19 or the flu. How can you protect yourself from the disease and how can you prevent spread of the disease?
- Explore the interactive SimPandemic tool to learn more about how a pandemic evolves.
Related Resources
Project Ideas
/-/https/www.sciencebuddies.org/cdn/Files/4774/11/Immune-system-antibodies-bacteria_img.jpg)
Activities
/-/https/www.sciencebuddies.org/cdn/Files/14571/5/medical-animation-coronavirus.jpg)
/-/https/www.sciencebuddies.org/cdn/Files/14469/8/cough-virus-thumbnail.jpg)
/-/https/www.sciencebuddies.org/cdn/Files/14785/12/diy-girl-with-face-mask-thumbnail.jpg)
/-/https/www.sciencebuddies.org/cdn/Files/14495/5/scratch-covid-19-simulator.jpg)
/-/https/www.sciencebuddies.org/cdn/Files/14323/5/hand-washing.jpg)
/-/https/www.sciencebuddies.org/cdn/Files/14409/8/use-hand-sanitizer-spray.jpg)
Lesson Plans
/-/https/www.sciencebuddies.org/cdn/Files/9103/5/antibodies-immune-system-overview.png)
- MS-LS1-3. Use argument supported by evidence for how the body is a system of interacting subsystems composed of groups of cells.
/-/https/careerdiscovery.sciencebuddies.org/cdn/Files/1294/17/iStock-1207951880.jpg)
/-/https/careerdiscovery.sciencebuddies.org/cdn/Files/1365/18/iStock-1012791028.jpg)
/-/https/careerdiscovery.sciencebuddies.org/cdn/Files/1486/17/pexels-photo-4033018.jpg)
/-/https/careerdiscovery.sciencebuddies.org/cdn/Files/1628/18/iStock-1203995945.jpg)
/-/https/careerdiscovery.sciencebuddies.org/cdn/Files/956/18/unsplash-mVV0s8ZvEm4.jpg)
/-/https/careerdiscovery.sciencebuddies.org/cdn/Files/17070/11/pexels-photo-5716042.jpg)
/-/https/img.youtube.com/vi/2wrcv28ODNg/0.jpg)
/-/https/img.youtube.com/vi/jr3BOE_EpOk/0.jpg)
/-/https/img.youtube.com/vi/6fx0PEx0g5k/0.jpg)