/-/https/www.sciencebuddies.org/Files/21464/5/sb-logo.png)
/-/https/www.sciencebuddies.org/Files/21464/5/sb-logo.png)
Make a Rain Gauge to Study Precipitation
Summary
/-/https/www.sciencebuddies.org/Files/13533/7/rain-gauge-in-use.jpg)
Overview
Rainstorms can be powerful! Can you guess how much water poured down during the last rainstorm you experienced? Do you know if a brief downpour yields more or less water compared to a daylong drizzle? In this hands-on weather lesson, students design, build and use their own rain gauge to get answers to all of these questions.
Learning Objectives
- Can use the word precipitation correctly
- Can draw, construct, and read a rain gauge
- Knows and understands the units of precipitation
- Can give a rough estimate of how much rain (in inches or mm) a rainy day delivers.
NGSS Alignment
This lesson helps students prepare for these Next Generation Science Standards Performance Expectations:- 3-ESS2-1. Represent data in tables and graphical displays to describe typical weather conditions expected during a particular season.
- 3-ESS2-2. Obtain and combine information to describe climates in different regions of the world.
|
Science & Engineering Practices
Developing and Using Models.
Develop a diagram or simple physical prototype to convey a proposed object, tool, or process.
Analyzing Data. Compare and contrast data collected by different groups in order to discuss similarities and differences in their findings. Use data to evaluate and refine design solutions. |
Disciplinary Core Ideas
ESS2.D: Weather and Climate.
Scientists record patterns of the weather across different times and areas so that they can make predictions about what kind of weather might happen next.
|
Crosscutting Concepts
Scale, Proportion and Quantity.
Students recognize natural objects and observable phenomena exist from the very small to the immensely large. They use standard units to measure and describe physical quantities such as weight, time, temperature, and volume.
|
Materials
/-/https/www.sciencebuddies.org/Files/13534/8/rain-gauge-materials-1.jpg)
For the class:
- Containers to make the body of a rain gauge. Good examples are empty, clean plastic bottles, milk containers, jars, tall food containers and cans. Select containers that have straight edges. A curved bottom is fine. They need to be waterproof; transparent containers are preferred.
- Materials and tools to finish the rain gauge. Examples are scissors, permanent markers, rulers, tape, paperclips, clay, water, gravel, wooden panel and glue.
- Water
- A few one gallon or larger containers (e.g. one-gallon milk or water containers) to make rain cans, a push pin and one opaque plastic bag to cover the container.
- Graph paper with a 1 cm squared grid like this one (at least 2 sheets)
- Optional: a few funnels that fit on the smaller containers.
- Optional: a hose with spray nozzle that allows different spray patterns.
- Outside area that can get wet
Background Information for Teachers
This section contains a quick review for teachers of the science and concepts covered in this lesson.Rain is one form of precipitation, together with snow, hail and sleet. Precipitation can be defined as any form of water falling from the sky onto earth's surface, or the amount of water falling on a certain area in a specific amount of time. Measuring the amount of precipitation is the focus of this lesson.
Precipitation is essential to life on earth. It refills our lakes, rivers and oceans; it seeps into the ground where it nourishes plants, fills aquifers (underground water reservoirs) and supplies water for springs. Too little precipitation, and life dies out, too much and you have devastating floods or landslides (Figure 1).
/-/https/www.sciencebuddies.org/Files/13535/7/desert-drought.jpg)
/-/https/www.sciencebuddies.org/Files/13536/8/cows-feeding-mammals-flooding.jpg)
Figure 1. Too little or too much precipitation can lead to drought and flooding
Meteorologists—scientists who study the weather and climate—keep a close eye on precipitation. They study short and long-term patterns in order to make predictions and warn people of upcoming dangerous situations such as flash floods or flooding, droughts, etc.
Precipitation is measured as the height of water collected in a container with straight edges that rise up at right angles with the bottom. It is expressed in inches or millimeters (mm). Figure 2 illustrates that precipitation measurements are independent of the surface covered by the collecting container. Although containers covering a larger surface collect more water, the height of the collected water is the same as that collected in a smaller container.
/-/https/www.sciencebuddies.org/Files/13537/7/rain-gauge-surface-area.png)
Figure 2. Two containers used to measure precipitation. Although the surface the containers cover is different, they measure the same height of rain.
For most regions, precipitation comes mainly in the form of rain. It is measured in a rain gauge (or udometer). Rain gauges are placed outside in an open area, so nothing obstructs the collection of precipitation. The most straightforward rain gauge is a transparent cylinder with an open top as shown in Figure 3 on the left. The water level in the gauge shows the precipitation in that area since the gauge was last emptied. Markings measured from the bottom of the cylinder make it easy to read the water level.
/-/https/www.sciencebuddies.org/Files/13538/7/straight-rain-gauge-image.jpg)
/-/https/www.sciencebuddies.org/Files/13539/7/funnel-rain-gauge-drawing.png)
Figure 3. Straight rain gauge (left) and funnel rain gauge (right).
A slightly more complicated design uses a funnel that guides water into a transparent cylinder (Figure 3, right). This design works better in areas where there is little rain, and often also reduces evaporation of collected water. The water level in the cylinder is still an indication of the precipitation but it is not the precipitation in inches or millimeters. You have to multiply the measured water level by the ratio of the funnel's diameter to the cylinder's diameter. The formula below can explain.
Other rain gauges have buckets that tip over when full. The number of tipped buckets is a measure of precipitation. Still others measure the mass of rain collected or use acoustic or optical measurements. In this lesson, students will design, make and test their own rain gauges in small groups.
Rain is classified according to the amount of water falling per hour. The table below lists the classification. One inch is 25.4 mm; rain of 1 inch/hour is a heavy downpour.
| Type | In millimeters per hour |
|---|---|
| Light | 2 - 4 |
| Moderate | 5 - 9 |
| Heavy | 10 - 49 |
| Violent | More than 50 |
The amount of water collected in a rain gauge might seem small, a few inches at most on a typical rainy day, but the volume of water quickly adds up. A roof that measures 40 by 70 feet (12 by 21 meters) collects about 1.74 gallons or 6.6 liters of water if your rain gauge measures 1 inch of precipitation; a square mile (2.6 km²) collects 17.38 million gallons of water (65.78 million liters). Using this number allows you to calculate the volume of water your city, village or school grounds would receive for 1 inch of precipitation: multiply the 17.38 million gallons by the area covered (expressed in square miles).
Where does all that water go? That depends on the rate at which the water falls, the geography and ground-cover of the area and the temperature. In a downpour, a lot of the water becomes surface runoff or water flowing over the land into creeks, streams, rivers and lakes. Urban areas have a much higher percentage of runoff. The high concentration of impermeable pavements and roofs, and the storm-sewer system account for that. The higher runoff drastically increases the chances of flooding. Water that falls at a slower rate has more time to infiltrate the ground and feed aquifers (underground water reservoirs) and vegetation. Water left in puddles or in wet surfaces evaporates. In the US, an average of about 70 percent of the precipitation returns to the atmosphere by evaporation from land and other small water surfaces, and by vegetation breathing out water vapor (referred to as transpiration). This water vapor feeds cloud formation, which leads to precipitation. This lesson briefly touches on what happens to the water that falls from the sky but leaves the water cycle for another lesson.
Additional Background Links
- Rain and Precipitation, USGS
- The Water Cycle, USGS
- The Engineering Design Process, Science Buddies.
Prep Work (15 minutes)
- Make two rain cans to simulate soft and heavy rain. Note: You do not need to make these rain cans if a water hose with a spray nozzle that allows different watering patterns is available to use.
To make the rain cans:
- Start with empty and clean plastic containers, one gallon or larger.
- Close the containers.
- Use a pushpin to push holes in the top of the containers. Make one container with holes about 1 cm apart, and another with holes about 2 cm apart.
- Draw a line near the top of the container to indicate the level to which the container should be filled.
- Fill the containers up once to test that they work as expected.
- Note: You can push on the container to create extra pressure once it becomes relatively empty.
/-/https/www.sciencebuddies.org/Files/13540/7/rain-can-holes.jpg)
/-/https/www.sciencebuddies.org/Files/13541/8/rain-can-in-use.jpg)
Figure 4. Homemade rain can.
- Look up precipitation data of your area, like the average and maximum precipitation for last year or for last month.
- If you do not have graph paper with a 1 cm squared grit, print at least 2 sheets.
- On one sheet of the graph paper, mark dots every 2 cm.
- Print out a student worksheet for each student.
Teacher Tool Box
Engage (30 minutes)
PhenomenonShow students Figure 5 (included in the slideshow) and ask them what they think or wonder when seeing this picture. Ask questions to make students think but do not give answers. This picture will be discussed at the end of the lesson.
Figure 5. Flooded land.
We will investigate rain and find out if rain could lead to flooding.
Demonstration
Bring the class outside for this demonstration of 2 different types of rain. If being outdoors is not possible, use following videos instead.
- Very soft rain that lasts for 2 hours, like in this video: https://pixabay.com/videos/rain-raindrops-puddle-drops-water-10885/
- Heavy rain that lasts for about 15 minutes, as shown in this video: https://pixabay.com/videos/rain-thunderstorm-lightning-clouds-305/
Announce your demonstration and ask: Which one of these rains do you think delivers more water?
Demonstration:
- If you have access to a water hose with a spray nozzle that allows different watering patterns:
- Show the students a fine mist (soft rain) that lasts for 30 seconds
- Show the students a heavy rain that lasts for 10 seconds
- If you use homemade rain cans (see preparation):
- Fill the containers to the predefined level and cover the container with an opaque plastic bag to prevent the students from seeing the water level.
- Let can 2 (soft rain, holes 2 cm apart) run for 30 seconds.
- Let can 1 (heavy rain, holes 1 cm apart) run for 10 seconds. If needed press on the can to create a steady flow.
/-/https/www.sciencebuddies.org/Files/14174/23/note-question-mark-30.png) | Which one delivers more water, the soft rain or the heavy rain? |
/-/https/www.sciencebuddies.org/Files/14175/24/conversation-bubbles-30.png) | Listen to the students' answers and reasoning. Count how many children choose soft rain, heavy rain or are undecided and write their predictions down. |
Introduce the lesson
| We will study rain today. What other words do you know for rain (e.g. shower)? Ask students to describe the type of rain (heavy or soft, huge or small drops, etc.) associated with the word. If students have recently experienced rain, ask them how they would describe that rain. |
| A downpour is a very heavy rain with large drops that gets you quickly soaked, a drizzle is a light rain with small drops, a rainstorm is heavy rain combined with strong wind, a shower is rain with large drops lasting for a short period. |
| Which one of these delivers most water if they go on for the same amount of time, like 5 minutes? |
| A downpour and rainstorm deliver a lot of water in a short period of time. A drizzle delivers much less water. |
| How can we know how much it rained? |
| Listen to the student's ideas. Ask questions that make students think about all aspects, like the duration and area. |
Meteorologists use rain gauges to measure how much it rained in that area. The rain gauge collects rain over a specific period of time, and meteorologists measure the height of the water collected in the gauge. They usually express it in inches or millimeters of rain over a 24-hour period.
| Why do you think they measure how much it rained? Why would they like to know? |
|
Meteorologist measure rainfall because
the information helps people make decisions, like whether or not there is a drought and water use should be restricted, how much a farmer should water his crops, whether or not people should be prepared for flooding, etc. |
Meteorologists also use the data to see long term changes in climate, and search for patterns in the collected data which can be used to make better predictions in the future.
| Is rain the only way water falls out of the sky? |
| No—ice, snow and sleet are other forms. The combination of all these is referred to as precipitation. |
Write the word 'precipitation' and its definition on the board.
Explore (80 minutes)
Split the class into small groups. Inform the students that each group will design, build and test a rain gauge. The worksheet will help guide them through the process. The students will be engineering groups and follow the engineering design process.
- Set goals
 Before we start, let's define what the rain gauge should be able to do.
 Let students think about the time period over which they will measure precipitation, where they will measure, what weather conditions their rain gauge should be able to survive, etc. As an example, the goal could be that the rain gauge will measure precipitation on the school campus over a 24-hour period, it will be reusable (we can use it day in and day out) and it will stay put in windy conditions.
This particular goal is included in the slides. Feel free to skip the slide and write the class's goals on the board for all to remember.
Engineers often cannot have all the supplies they would wish for, and your student engineers cannot either. Show students the supplies they can use. This could include large and small plastic bottles, milk cartons, jars, tall plastic takeout containers, cans, tape, scissors, rulers, permanent markers, paperclips, clay, water, gravel, etc. If possible, add a few funnels. Avoid containers that have slanted or curved sides. It is OK if the bottom is not flat; that can be adjusted by filling the bottom with clay, water, etc.
- Background research
Engineers do research on what already exists before starting a project. Explain that you did some research and found what meteorologists use and what makes it possible to compare their measurements.
Meteorologists use rain gauges to measure precipitation. The gauge collects rain and meteorologists measure the height of the water collected in the gauge and express it in inches or millimeters. Because the shape of the container influences the height of the water collected, meteorologists use containers that have a flat bottom and straight walls rising at a right angle with the bottom (top drawings in Figure 6). The level is different if water is in containers that have a different shape.
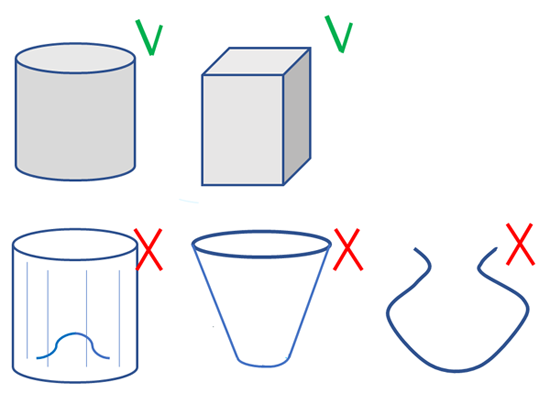
Figure 6. Containers with a flat bottom and straight walls that make right angles with the bottom are the easiest to make rain gauges from.Show your students some different shaped containers. Which ones could be used almost instantly as a rain gauge, and which ones need alterations or would need a formula to calculate the precipitation from the measured water level?Containers that have the following attributes can instantly be used as rain gauges.- A flat bottom
- Straight walls that make right angles with the bottom
- No narrowing or widening parts near the top
Containers that do not have these attributes can also be used as rain gauges, but will need to be altered (a container with a uneven bottom could have clay added to make a level surface) or will need a formula applied when taking measurements (when a funnel is used to collect more rain water in the gauge).
-
Brainstorm ideas
Students start by exchanging ideas in their small groups. Allow students to ask you for additional information. If you do not know the answer, tell them you will look it up and give them a reasonable assumption so the students can start designing.
Ask each student to draw their best design on their worksheet.
- Evaluate ideas
Have a class discussion about what makes a good rain gauge.
Now that you have had time to think, what are some questions we can ask to evaluate if our designs will work and be practical?- Easy to measure the level of water. An example could be a gauge that has a scale written on the gauge.
- Easy to empty so it can be reused. As an example, if you can pick up the gauge and pour out the water, it is easy to reuse.
- Sturdy. As an example, glass might break, or a plastic bag might rip but a thick plastic milk container is durable.
- Kept on the ground or a table so it does not fall over when it is windy. Adding a heavy bottom or gluing the container to a wooden panel helps.
- Held level so the water level is horizontal (at the same height when viewed from all sides of the container).
Students might find more criteria. Give students time to check their designs and allow them to make adjustments.
Let students discuss which design their group will build or choose for them.
- Build the rain gauge
Let students build their rain gauges independently. Check in with each group and provide support where needed.
- Test the rain gauges
If you do not have a water hose with a spray nozzle, allow groups that are done early to make extra rain cans using the procedure below. Make sure they do a detailed job so the containers model rain accurately.
- Start with an empty, clean plastic container, one gallon or larger.
- Tape the graph paper or the paper with the 2 cm grid on the top part of the container.
- Use a pushpin to push holes through the paper into the top of the container following the grid. Some containers will have holes 1 cm apart, and others will have holes 2 cm apart.
- Write the number 1 on the containers with holes 1 cm apart, number 2 on the others.
- Remove the grid paper.
- Draw a line near the top of the container. This line indicates the level to which to fill the container.
- Fill the container with water.
- Close the container.
- To model rain, turn the container upside down and let the water flow out through the tiny holes.
- If the container allows you to, push the plastic in as the water level in the container decreases. This creates a steady water flow.
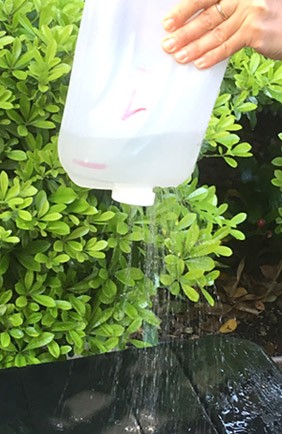
Figure 7. Homemade rain can in use.If you use the water hose to model rain:
- Let the students place their rain gauges in groups. Test the fine mist (soft rain) kept steady for 30 seconds and the heavy rain that lasts 10 seconds. Make sure to point the hose up so the water comes down almost vertically over the gauges.
If you use the rain cans to model rain:
- Let students install the rain gauges outside, where they would use them to measure precipitation.
- Explain to the students how to use the rain cans. They need to be filled to the same level each time; they need to be turned upside down completely and need to be held at the same distance over the rain gauge with the rain gauge centered under the shower (see Figure 8). Ask students to push the rain can in when the water starts to move out. These measures help create a similar rain pattern for the tests.
- Let students test independently over a set time period like 30 seconds. Let a partner time the rain.
- Each group should test with a can labeled 1 (hard rain) and with a can labeled 2 (soft rain). They should measure the precipitation (water level) in inches or millimeters after testing with each can.
- ATTENTION: Have at least 4 groups use the same two rain cans for their tests. This ensures these groups measure a very similar rain pattern and should give measurements that are fairly close to each other. Groups using different rain cans can still compare their measurements but might see a larger variation in results.
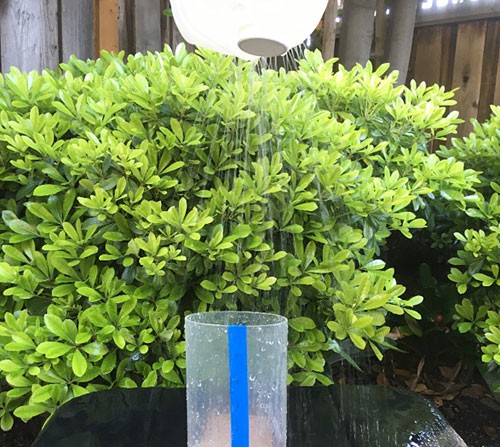
Figure 8. Test setup using rain cans.After each test, let students measure the precipitation on their gauges and fill in the results on their worksheet. Let one group show how they read their rain gauge. Point out that it is important to set the gauge on a horizontal surface before measuring and illustrate what happens if you do not hold the gauge level by exaggerating (see Figure 9).
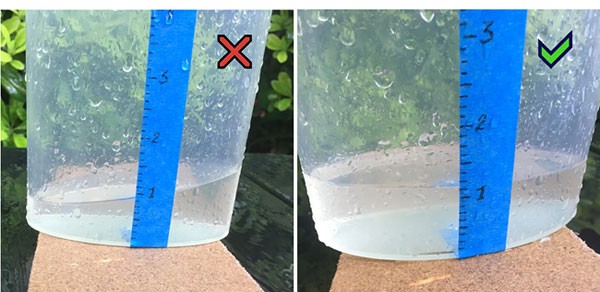
Figure 9. To read a rain-gauge, it needs to be placed on a horizontal surface.Let groups who used the same rain cans or same hose for their tests discuss how their measurements are similar and different. Let them explore reasons why these differences might occur.
As a class, discuss any similarities and differences groups discovered. What could account for those differences?Small differences can come from the difference in rain patterns. It is hard to make sure the water hose or rain can provide identical patterns. Wind might also create differences. Different ways of rounding measurements can also introduce small differences.Below are a few important reasons why larger differences can occur:
- Not reading the rain gauge correctly like holding the gauge at an angle when reading it.
- Using a funnel to collect rain. This yields a water level that is higher than expected. You can explain students that this is sometimes done. For these rain gauges, a formula (see Formula 1) is used to calculate precipitation from the measured water level. Note students are not expected to know or use the formula!
Formula 1: - Rain gauges that have an uneven bottom will artificially increase the water level, yielding precipitation readings that are higher than expected (see Figure 10). One can use clay, water, gelatin or Plaster of Paris to fill the uneven bottom part of the rain gauge. This can create a flat bottom to start measuring from.
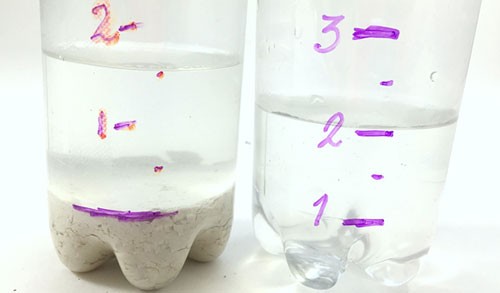
Figure 10. Rain gauges with an uneven bottom can give artificially high readings if one does not correct for the unevenness.Allow students to adjust their rain gauge where needed.
Finally, let students install their rain gauges to collect real rain or other forms of precipitation in the coming days. Use the time period agreed upon at the start of the lesson as time period over which to check back.
/-/https/www.sciencebuddies.org/Files/13542/7/rain-gauge-container-shapes.png)
/-/https/www.sciencebuddies.org/Files/13543/9/test-setup-using-rain-cans.jpg)
/-/https/www.sciencebuddies.org/Files/13544/10/read-rain-gauge-horizontal-surface.jpg)
/-/https/www.sciencebuddies.org/Files/13545/11/rain-gauges-uneven-bottom.jpg)
Reflect (20 minutes)
| Now that you have designed, made and tested a rain gauge, what did you learn about rain gauges and precipitation? |
| The answer will depend on the experience. Maybe students felt that it was easy to make a rain gauge and difficult to secure it. It might have surprised them how little water was collected in the short test time. Making the gauge might have helped them realized that rain gauges need to have a flat bottom to measure correctly, or that it is important to test and compare the results. Students might also comment on how it felt to work together on a design project. |
Leave the students some time to think about their rain gauge. Maybe what they have learned can help them make even better rain gauges! Let students draw their new ideas on the worksheet.
Meteorologists classify rain by how fast the water comes down. The classification is as follows (the overview is listed in the slides):
| Type of precipitation | Precipitation [mm/hour] |
|---|---|
| Light | 2 - 5 |
| Moderate | 5 -10 |
| Heavy | 10 - 40 |
| Violent | More than 50 |
| How much rain would be collected by 10 hours of light rain of 3 mm/hour? |
| 3 times 10 equals 30 mm. This rain would deliver 30 mm of rain or 1.2 inches. |
| How long would it need to rain at a rate of 20 mm/hour (heavy rain) to deliver the same amount of water? |
| 20 mm/hour times 1.5 hours equals 30 mm.
It needs to rain 1.5 hours at 20 mm/hour to collect the same amount of water.
|
| For the demonstration at the start of the lesson, [ fill in how many] thought the soft rain delivered more water, [ fill in how many] thought the harder rain delivered more water. Did your opinion change? |
| If you can, repeat the experiment and measure which scenario yields more water using the rain gauges. For the video, there is unfortunately no way to know. |
| So, longer and heavier rain delivers more water. What about rain over a larger area? If 1 square mile delivers about 17.38 million gallons of water in a 1-inch rainstorm,
how much water would we collect over [the campus or the village] during a 1 inch rain?
Add the surface of the chosen area expressed in square miles. |
| The answer will depend on the area chosen. Multiply the area in square miles by 17.38 million gallons to find the answer. |
| What happens to all that water? If students need a hint, ask them what happened to the water that did not end up in the rain gauge during their tests. |
| The water can
|
|
| The answers will depend on what the class thought. In general, floods can happen after a heavy rainstorm or a prolonged period of rain. Even if a rain gauge only measures a few inches of rain, if the ground cannot absorb water (maybe it's already saturated from many days of rain), the water that fell over a large area might collect and cause flooding. |
That is one reason why knowledge about precipitation and precipitation patterns is important. The weather forecasts can warn people about upcoming rain and danger for flooding.
Assess
You can use the quiz to assess student learning after the activity.
- Online quiz, assignable in any LMS
- Quiz (pdf) and Answer key (pdf)
Make Career Connections
Discussing or reading about these careers can help students make important connections between the in-class lesson and STEM job opportunities in the real world.
/-/https/careerdiscovery.sciencebuddies.org/cdn/Files/815/17/unsplash-5hZJVGPG6vo.jpg)

/-/https/careerdiscovery.sciencebuddies.org/cdn/Files/1141/17/iStock-1170687091.jpg)
Lesson Plan Variations
- Students can create rain gauges that use funnels to collect more rain. Let them explore how these gauges can be more accurate but need calculations to be able to compare the measurements to other rain gauges.
- Let students track rain and other weather characteristics like the direction and strength of the wind, presence of clouds and the type of clouds, temperature, etc. Can they find patterns in this data? Can these patterns help them predict rain?
- Let students look up the area in the US or the world that receives the least precipitation and the area that receives the most precipitation, on average, in a year. How does the precipitation in the area they live in compare to those areas?
- Let students look up how precipitation in the area they live in changes with the months or seasons.
- Let students look up information on flooding. When and where does flooding occur? If a river floods due to heavy rain, how much (in inches) did it rain in that area? How much did the water level in the river rise? Did it rise only where it rained or also downstream?
- Students can use their rain can to examine how different ground covers change the runoff created by one type of rain. They can also study the runoff created by a downpour compared to that of a soft rain.
/-/https/img.youtube.com/vi/M8e6T-Hc9wE/0.jpg)
/-/https/img.youtube.com/vi/XwJQJnY6iUs/0.jpg)
/-/https/img.youtube.com/vi/9ZQz2IUEtO8/0.jpg)