Send That Signal!
Summary

Overview
Here is a challenge for your students: you need to send a number to someone on the other side of the classroom. The twist? You are not allowed to talk, write the number down, or use gestures or sign language! How would you do it? In this project, your students will explore different means of transmitting information by sending a message to a phone that can graph light, sound, and vibrations using a specific sensor app. They will learn about different sensors and interpreting graphs, and use the data they gather to collaborate and determine how best to transmit the message.Learning Objectives
- State what a microphone, light sensor, and accelerometer measure.
- Compare different methods to send a signal and determine which one works best over shorter versus longer distances.
- Interpret graphical data from a microphone, light sensor, or accelerometer and give explanations of what could have caused changes in the graph.
NGSS Alignment
This lesson helps students prepare for these Next Generation Science Standards Performance Expectations:- 4-PS4-3. Generate and compare multiple solutions that use patterns to transfer information.
|
Science & Engineering Practices
Constructing Explanations and Designing Solutions. Generate and compare multiple solutions to a problem based on how well they meet the criteria and constraints of the design solution.
|
Disciplinary Core Ideas
ETS1.C: Optimizing the Design Solution. Different solutions need to be tested in order to determine which of them best solves the problem, given the criteria and the constraints.
|
Crosscutting Concepts
Patterns. Similarities and differences in patterns can be used to sort and classify designed products.
Interdependence of Science, Engineering, and Technology. Knowledge of relevant scientific concepts and research findings is important in engineering. |
Materials
 Image Credit: Ben Finio, Science Buddies / Science Buddies
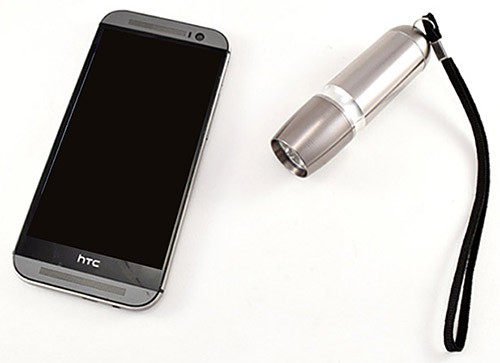
- Flashlight
- Smartphone with a sensor app such as phyphox, available for free on
Google Play for Android devices (version 4.0 or newer) or from the App Store for iOS devices (iOS 9.0 or newer). Note: Phyphox does not support the light sensor on iOS devices. If you need the light sensor, you have to use Android devices for your experiment. Note that on some devices the light sensor is only updated when there is a coarse change of illuminance. This means that if the light intensity does not change or only changes slightly, the sensor appears to not record any data. The recording will continue once the light intensity changes again. If your experiments allows, it helps to wiggle the phone or the light source (e.g. flashlight) slightly to induce minimal reading fluctuations and keep the sensor active.
Background Information for Teachers
This section contains a quick review for teachers of the science and concepts covered in this lesson.In this lesson, your students will use a mobile phone equipped with a sensor app to try to send a signal across the classroom. The sensor app gives real-time access to data from electronic sensors that are built into many smartphones, including:
- an accelerometer, which detects motion and vibrations; measured in meters per second squared (m/s²)
- a microphone, which detects sound; measured in decibels (dB)
- a light sensor, which detects light; measured in lux (lx)
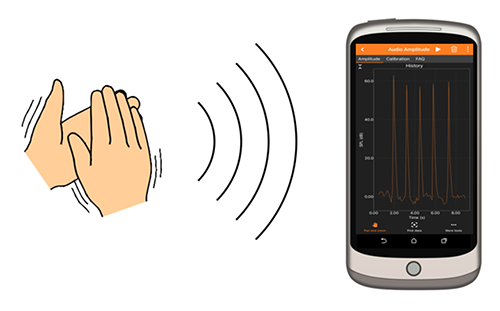
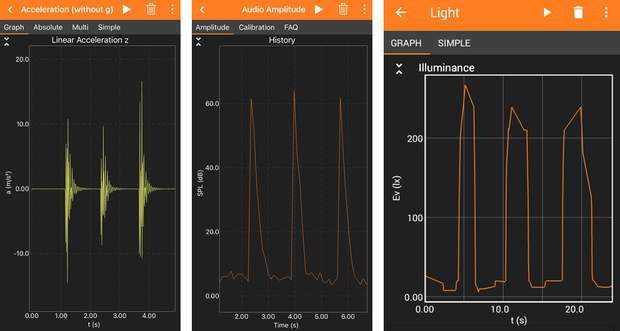
Your students will try to communicate a simple number (like "3") by counting the number of peaks in a graph showing each sensor's output. For example, the following graphs show typical results from banging your fist on a table next to the phone (accelerometer), clapping your hands near the phone (microphone), and clicking a flashlight aimed at the phone on and off (light sensor) three times each:
 Image Credit: Svenja Lohner, Science Buddies / Science Buddies
Example graph showing acceleration over time of a smartphone placed on a table that is bumped. The graph is relatively level with 3 spikes downward evenly spaced throughout which occur when the table is shaken. The minimum acceleration is 8.1, the maximum is 10 and the average is 9.7 meters per second squared. The next example graph shows sound intensity over time. Three spikes in the graph indicate brief sounds in a quiet setting that are spaced relatively evenly apart. The minimum sound measured is 16, average is 23 and maximum is 74 decibels. The next example graph shows ambient light over time. Three increases in the graph indicate a light that is turned on and off at evenly spaced intervals. The minimum light measured is 150, average is 2,000 and maximum is 4,000 lumens.
These graphs were all recorded with the source of the signal very close to the phone. As the phone gets farther away, the signal gets weaker and becomes subject to noise and interference. For example, the flashlight might be drowned out by bright light from a window, and noisy classmates might make it hard to clearly see the peaks on the microphone graph. Your students will start with the phone very close, and gradually move it farther away while testing all three sensors to find out which one works best to send a signal all the way across the classroom.
Note: you might be thinking "wait a minute; sound waves are vibrations, too!" Technically, this is correct. Sound waves are vibrations that travel through the air, and these are detected by your phone's microphone. However, they are not detected by the accelerometer. The accelerometer detects motion, meaning the vibrations must be powerful enough to cause the phone to move. Clapping your hands near the phone does not cause it to move, but banging your fist on the table does, so the latter is detected by the accelerometer.


