/-/https/www.sciencebuddies.org/cdn/Files/21464/5/sb-logo.png)
/-/https/www.sciencebuddies.org/cdn/Files/21464/5/sb-logo.png)
Send That Signal!
Summary
/-/https/www.sciencebuddies.org/cdn/Files/8587/18/data-transmission-phone-thumbnail.png)
Overview
Here is a challenge for your students: you need to send a number to someone on the other side of the classroom. The twist? You are not allowed to talk, write the number down, or use gestures or sign language! How would you do it? In this project, your students will explore different means of transmitting information by sending a message to a phone that can graph light, sound, and vibrations using a specific sensor app. They will learn about different sensors and interpreting graphs, and use the data they gather to collaborate and determine how best to transmit the message.Learning Objectives
- State what a microphone, light sensor, and accelerometer measure.
- Compare different methods to send a signal and determine which one works best over shorter versus longer distances.
- Interpret graphical data from a microphone, light sensor, or accelerometer and give explanations of what could have caused changes in the graph.
NGSS Alignment
This lesson helps students prepare for these Next Generation Science Standards Performance Expectations:- 4-PS4-3. Generate and compare multiple solutions that use patterns to transfer information.
|
Science & Engineering Practices
Constructing Explanations and Designing Solutions. Generate and compare multiple solutions to a problem based on how well they meet the criteria and constraints of the design solution.
|
Disciplinary Core Ideas
ETS1.C: Optimizing the Design Solution. Different solutions need to be tested in order to determine which of them best solves the problem, given the criteria and the constraints.
|
Crosscutting Concepts
Patterns. Similarities and differences in patterns can be used to sort and classify designed products.
Interdependence of Science, Engineering, and Technology. Knowledge of relevant scientific concepts and research findings is important in engineering. |
Materials
/-/https/www.sciencebuddies.org/cdn/Files/8588/16/send-message-materials.jpg)
- Flashlight
- Smartphone with a sensor app such as phyphox, available for free on
Google Play for Android devices (version 4.0 or newer) or from the App Store for iOS devices (iOS 9.0 or newer). Note: Phyphox does not support the light sensor on iOS devices. If you need the light sensor, you have to use Android devices for your experiment. Note that on some devices the light sensor is only updated when there is a coarse change of illuminance. This means that if the light intensity does not change or only changes slightly, the sensor appears to not record any data. The recording will continue once the light intensity changes again. If your experiments allows, it helps to wiggle the phone or the light source (e.g. flashlight) slightly to induce minimal reading fluctuations and keep the sensor active.
Background Information for Teachers
This section contains a quick review for teachers of the science and concepts covered in this lesson.In this lesson, your students will use a mobile phone equipped with a sensor app to try to send a signal across the classroom. The sensor app gives real-time access to data from electronic sensors that are built into many smartphones, including:
- an accelerometer, which detects motion and vibrations; measured in meters per second squared (m/s²)
- a microphone, which detects sound; measured in decibels (dB)
- a light sensor, which detects light; measured in lux (lx)
Your students will try to communicate a simple number (like "3") by counting the number of peaks in a graph showing each sensor's output. For example, the following graphs show typical results from banging your fist on a table next to the phone (accelerometer), clapping your hands near the phone (microphone), and clicking a flashlight aimed at the phone on and off (light sensor) three times each:
/-/https/www.sciencebuddies.org/cdn/Files/17216/5/vibration-sound-light-graph-3.png)
Example graph showing acceleration over time of a smartphone placed on a table that is bumped. The graph is relatively level with 3 spikes downward evenly spaced throughout which occur when the table is shaken. The minimum acceleration is 8.1, the maximum is 10 and the average is 9.7 meters per second squared. The next example graph shows sound intensity over time. Three spikes in the graph indicate brief sounds in a quiet setting that are spaced relatively evenly apart. The minimum sound measured is 16, average is 23 and maximum is 74 decibels. The next example graph shows ambient light over time. Three increases in the graph indicate a light that is turned on and off at evenly spaced intervals. The minimum light measured is 150, average is 2,000 and maximum is 4,000 lumens.
These graphs were all recorded with the source of the signal very close to the phone. As the phone gets farther away, the signal gets weaker and becomes subject to noise and interference. For example, the flashlight might be drowned out by bright light from a window, and noisy classmates might make it hard to clearly see the peaks on the microphone graph. Your students will start with the phone very close, and gradually move it farther away while testing all three sensors to find out which one works best to send a signal all the way across the classroom.
Note: you might be thinking "wait a minute; sound waves are vibrations, too!" Technically, this is correct. Sound waves are vibrations that travel through the air, and these are detected by your phone's microphone. However, they are not detected by the accelerometer. The accelerometer detects motion, meaning the vibrations must be powerful enough to cause the phone to move. Clapping your hands near the phone does not cause it to move, but banging your fist on the table does, so the latter is detected by the accelerometer.
Prep Work (15 minutes)
Make sure you are familiar with the sensor app you are using before you show it to your students. The best way to do this is to play with the app on your phone to get comfortable enough using it to explain it to your students. Ideally, you want to test the experiment yourself with the app before class to make sure it works as intended.Follow these instructions to try the app yourself:
- When using the phyphox app, open the accelerometer (without g) function and go to the "absolute" tab (not the individual X, Y, or Z accelerometers) to measure the absolute acceleration. Put the phone down on a table, press the play button to start a recording, and bang your fist next to the phone. You should see spikes in the graph when you bang your fist (the graph might show multiple smaller spikes each time you bang your first, since the phone might bounce a bit). The peaks will get smaller as you move the phone farther away.
- When using the phyphox app, open the audio amplitude function in the app. Press the play button to start a recording and clap your hands or make another brief, loud noise near the phone. You should see clear peaks in the graph. These peaks will get smaller as the phone gets farther away, and will be harder to make out in a noisy room. Note, that phyphox recommends to calibrate the sound sensor before each measurement. However, for the purpose of this lesson, a calibration is not necessary as you are only interested in the relative sound intensity changes and do not need absolute decibel readings. If you are interested in the absolute decibel readings you should calibrate the sound sensor before your measurements.
- When using the phyphox app, open the light sensor and aim a flashlight at the phone's light sensor (make sure you know the location of the light sensor on your phone). You should see an increase on the graph. Depending on the strength of your flashlight and brightness of the room, if you move it too far away, it might be drowned out by the ambient light levels. Note, that on some devices the light sensor is only updated when there is a coarse change of illuminance. This means that on these devices the phyphox app does not seem to record any data if the light intensity does not change or only changes slightly.
- Practice recording and saving trials with the different sensors. This will allow you to clearly organize your data as your class does different tests.
If you only have one phone, you will need to figure out the best way to show the screen to your entire class. You can have the students gather in a semi-circle so you can easily show all of them the screen. If you have a digital projector available, you may be able to project the phone's screen. How you do this will vary depending on the type of phone and computer you have. For example, search online for "how to mirror Android phone screen on PC."
Teacher Tool Box
Engage (10 minutes)
- Ask your students to think about different ways they communicate. Make a list of your students' ideas on the board.
 What are some ways you could communicate with a friend who is in the same room?
 Possible answers include talking, sign language, and writing notes.What if your friend was in a different city? What are some ways you might communicate with your friend?Possible answers include talking on the phone, video chat, e-mail, and sending letters.What are some ways that people communicated over long distances before modern technology? You may need to prompt students to think about different historical time periods and cultures (ancient Greeks, Native Americans, et cetera).Possible answers include smoke signals, lighthouses, drumming, and Morse code sent by telegraph.
 - Present your students with a simple challenge: they need to communicate a single number (like "3") to someone on the other side of the classroom. But, they are not allowed to talk, write the number down, or use gestures!
How could you communicate a number across the classroom without talking, writing it down, or using gestures?Possible answers include waving your hand three times or flicking the classroom lights on and off three times.
-
Introduce the sensor app to your students.
Open the light sensor in the app, press the play button to start a recording, flick the classroom lights on and off a few times, and stop recording. Save your data and show the resulting graph to your students.
Can you count how many times the lights were turned on and off based on the graph?You should see the graph go up when the lights are on and down when the lights are off. This allows you to count how many times the lights were turned on and off. For example, in this graph the lights were turned on and off three times:
/-/https/www.sciencebuddies.org/cdn/Files/14175/24/conversation-bubbles-30.png)
/-/https/www.sciencebuddies.org/cdn/Files/8592/14/light-graph-3-peaks.png)
Example graph showing light intensity over time for a flashlight that is turned on and off repeatedly. The graph has three large plateaus that are evenly spaced, and each increase in the graph occurs when the flashlight is turned on. The minimum light measured is about 20 and the maximum is about 350 lux.
Explore (30 minutes)
- Challenge your students to send a number (for example, three) to the phone over a relatively short distance. Start by exploring the different sensors and what their graphs look like in response to different signals. Students can draw what the graphs look like using this
worksheet.
- Put the phone down on a table. When using the phyphox app, open the accelerometer (without g) function and go to the "absolute" tab (not the individual X, Y, or Z accelerometers) to measure the absolute acceleration. Press the play button to start a recording and have a student bang his/her fist on the table right next to the phone three times, with a slight pause between each knock, then stop recording, save your data, and show the graph to your class.
What happens to the graph when the student bangs his or her fist on the table? Can you tell from the graph how many times s/he knocked?Knocking on the table causes it to vibrate. This vibration is transferred to the phone since it is sitting on the table, and detected by the accelerometer inside the phone. The vibrations show up as spikes on the graph—the harder you hit the table, the bigger the spikes. If you hit the table three times, you should see three spikes.
- Ask your students to be quiet. Open the sound sensor in the app (audio amplitude in phyphox). Note, that phyphox recommends to calibrate the sound sensor before each measurement. However, for the purpose of this lesson, a calibration is not necessary as you are only interested in the relative sound intensity changes and do not need absolute decibel readings. If you are interested in the absolute decibel readings you should
calibrate the sound sensor
before your measurements. Once your sound sensor is ready to go press the play button to start a recording. With the phone on the table, have one student clap his or her hands near the phone three times, then stop recording, save your data, and show the graph to your class.
What happens to the graph each time the student claps his or her hands? Can you tell from the graph what number we were trying to communicate?When you make any type of noise, sound waves (vibrations of air molecules) travel through the air and are detected by the phone's microphone. Sound waves dissipate as they travel farther away. Short, loud noises like a clap right next to the phone show up as clear spikes in the graph.
- With the phone on the table, open the light sensor in the app and press the play button to start a recording. Have a student hold a flashlight directly over the phone and turn it on and off three times, then stop recording, save your data, and show the graph to your class.
What changes do you see in the graph with each flicker of the flashlight? Can you tell from the graph how many times the flashlight was turned on and off?When you aim the flashlight at the phone and turn it on, more light hits the phone (in addition to the ambient light already hitting the phone from the classroom lights and windows). This causes the graph to go up until you turn the flashlight off again. If you turned the flashlight on and off three times, you should see the graph go up and back down three times.
- Put the phone down on a table. When using the phyphox app, open the accelerometer (without g) function and go to the "absolute" tab (not the individual X, Y, or Z accelerometers) to measure the absolute acceleration. Press the play button to start a recording and have a student bang his/her fist on the table right next to the phone three times, with a slight pause between each knock, then stop recording, save your data, and show the graph to your class.
- Now see if your students can increase the distance over which they can send a signal. Try putting the phone at one end of a long table and asking students to send a signal from the other side. Go through each of the sensors (accelerometer, microphone (audio amplitude in phyphox), and light) again from this longer distance.
Can you still send a signal using each sensor? Can you still easily count the number of spikes in the graph? What changes as you increase the distance?At short distances, it is relatively easy to send a signal to the phone using all three sensors. At longer distances, however, the spikes in the graphs might start to get smaller, because the signals get weaker with distance. For example, compare these microphone graphs recorded while clapping right next to the phone (left) and from farther away (right):
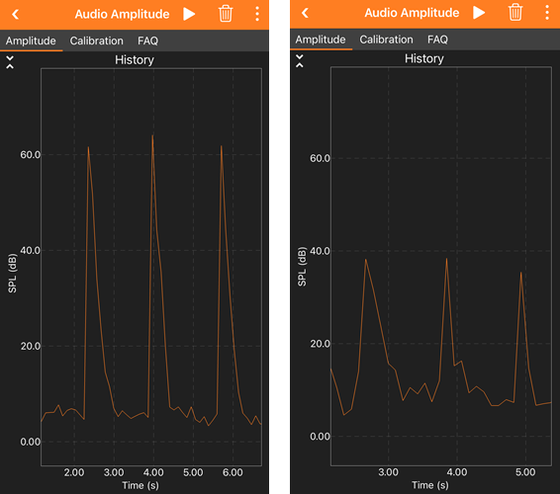
The first example graph showing sound intensity over time when two hands clap together. The graph is relatively level with 3 spikes that are evenly spaced which occur when hands clap and make a sound. The maximum sound measured is about 60 decibels.The next example graph shows sound intensity over time in a quiet class setting. Three spikes in the graph indicate brief sounds that are spaced relatively evenly apart. The maximum sound measured is about 40 decibels.
- Now put the phone on one side of your classroom and see if your students can send a signal to it from the other side. Again, go through all three sensors.
Can you send a clear signal across the whole classroom using any of the sensors? If any of the sensors do not work, what problems can you identify? Does the orientation of the phone matter?The results when sending a signal across an even longer distance will depend heavily on the conditions in the classroom. For example, if your students are being noisy, it might be harder to see spikes in the graph when someone claps their hands. Compare these two graphs, one that shows hands clapped five times in a quiet room (left), and one recorded in a noisy room (right). The spikes are harder to make out on the noisy graph.
/-/https/www.sciencebuddies.org/cdn/Files/17217/5/microphone-close-far.png)
/-/https/www.sciencebuddies.org/cdn/Files/17218/5/microphone-quiet-noisy.png)
The first example graph showing sound intensity over time when two hands clap together. The graph is relatively level with 5 spikes that are evenly spaced which occur when hands clap and make a sound. The maximum sound measured is about 60 decibels. The next example graph shows sound intensity over time in a noisy classroom. Five spikes in the graph indicate brief sounds spaced relatively evenly apart that are difficult to distinguish from fluctuating background noise. The maximum sound measured is about 60 decibels.
Troubleshooting
- Your students will probably find that the accelerometer does not work very well to send signals over long distances. The vibrations they create (for example, by stomping your foot or banging on a table) do not travel far enough to be easily picked up by the phone. However, there is nothing wrong with this—discovering it and comparing it to the other methods is part of the activity for your students!
- If there are bright ceiling lights in your classroom or open windows on a sunny day, it may be difficult to transmit a signal using a flashlight, because it will be drowned out by the ambient light. Again, there is nothing wrong with this—discovering it is part of the activity. Your students might find out that a flashlight works better to send the signal if you turn off the classroom lights and close the window blinds.
Reflect (5 minutes)
Discuss the following questions as a class. You may want to ask students to write their individual answers to these questions on the student worksheet first.
/-/https/www.sciencebuddies.org/cdn/Files/14174/23/note-question-mark-30.png) |
Which method was the most reliable to send a signal over a very short distance?
|
|
Which method worked best to send a signal across the entire classroom?
|
|
Did you have to make any changes or adjustments in order to send a signal across the entire classroom (for example, turning off the classroom lights, or asking everyone to be quiet)?
|
Assess
You can use this quiz to assess student learning after the activity; quiz is available in online and pdf formats:
- Online quiz, assignable in any LMS
- Quiz (pdf) and answer key (pdf)
Make Career Connections
Discussing or reading about these careers can help students make important connections between the in-class lesson and STEM job opportunities in the real world.
/-/https/careerdiscovery.sciencebuddies.org/cdn/Files/1153/17/pexels-photo-1181354.jpg)

/-/https/careerdiscovery.sciencebuddies.org/cdn/Files/1163/18/pexels-photo-1181472.jpg)
Lesson Plan Variations
- Have your class explore what happens if you introduce noise and interference to the environment. For example: can you still send a signal using the accelerometer if other people are drumming their fingers on the table? Can you send a signal with the flashlight if other people are walking between the phone and the flashlight or flicking the classroom lights on and off? Can you send a signal by clapping your hands if other people are singing loudly?
- You can think of this project as demonstrating "wireless" data transfer because the information is sent through the air (or in the case of vibrations, through a table or desk). Can your students design ways to send information over "wires" instead? For example, a string-and-paper-cup phone to transmit sound, or a long cardboard tube to transmit light? Can these methods transmit information better over long distances or in the presence of noise? What are the advantages and disadvantages of wireless and wired communication?
- This lesson plan had your students send a very simple message—just a single number. Can your students use the techniques they developed to send more complicated messages, for example, like using Morse code to send letters of the alphabet? What about sending larger numbers? It would not be very efficient to clap your hands 100 times in order to send the number "100." Can they do it using binary code instead?
- How does the activity change if you use multiple phones in the same classroom? Is it possible to send a signal to just one phone but not the other ones? For example, what if two people try to send messages to two different phones at the same time—can they do so without interfering with each other?
/-/https/img.youtube.com/vi/bj0fVIqGAds/0.jpg)
/-/https/img.youtube.com/vi/q8udWLU2HQk/0.jpg)
/-/https/img.youtube.com/vi/9ayEvwmO8GI/0.jpg)