/-/https/www.sciencebuddies.org/cdn/Files/21464/5/sb-logo.png)
/-/https/www.sciencebuddies.org/cdn/Files/21464/5/sb-logo.png)
Perfect Pitches with a Rubber Band Guitar
Summary
/-/https/www.sciencebuddies.org/cdn/Files/17250/6/sound-wave-main.jpg)
Two sharpies lie parallel to each other on either side of a hole cut into the lid of a cardboard box. A rubber band holds the sharpies in place and stretches directly over the hole in the box. When the rubber band is plucked sound is produced and is recorded on a nearby smartphone.
Overview
We are surrounded by sounds every day, ranging from unpleasant ones like traffic noise to enjoyable ones like music or singing birds. What makes these sounds different? Why are some louder or higher pitched than others? In this lesson plan, your students will investigate how the properties of a sound wave, like frequency and amplitude, affect the sounds we hear. They will do this using a sensor app than can record sound and frequency data with a mobile phone and a homemade musical instrument—a rubber band guitar!Learning Objectives
- Draw and identify wave patterns with varying wave characteristics such as different frequencies and amplitudes.
- Describe how wave characteristics such as frequency and amplitude correspond to sound pitch and sound volume.
- Understand how to generate high/low pitch notes with varying volumes using a string instrument.
NGSS Alignment
This lesson helps students prepare for these Next Generation Science Standards Performance Expectations:- MS-PS4-1. Use mathematical representations to describe a simple model for waves that includes how the amplitude of a wave is related to the energy in a wave.
|
Science & Engineering Practices
Planning and Carrying Out Investigations.
Collect data to produce data to serve as the basis for evidence to answer scientific questions or test design solutions under a range of conditions.
Conduct an investigation and/or evaluate and/or revise the experimental design to produce data to serve as the basis for evidence that meet the goals of the investigation Analyzing and Interpreting Data. Analyze and interpret data to provide evidence for phenomena. Constructing Explanations and Designing Solutions. Apply scientific reasoning to show why the data or evidence is adequate for the explanation or conclusion. |
Disciplinary Core Ideas
PS4.A: Wave Properties.
A simple wave has a repeating pattern with a specific wavelength, frequency, and amplitude.
|
Crosscutting Concepts
Patterns.
Graphs and charts can be used to identify patterns in data.
Cause and Effect: Mechanism and Prediction. Cause and effect relationships may be used to predict phenomena in natural or designed systems. |
Materials
/-/https/www.sciencebuddies.org/cdn/Files/12186/11/materials-rubber-band-guitar.jpg)
Materials for teacher:
- Rope or Slinky®
- Scissors, or box cutter if you are using cardboard boxes
Materials per group of students:
- Cardboard box or tissue box (with single hole on one side)
- Rubber band big enough to stretch around the box and cover the hole
- Pencils, markers, or crayons (2)
- Smartphone with a sensor app such as phyphox, available for free on Google Play for Android devices (version 4.0 or newer) or from the App Store for iOS devices (iOS 9.0 or newer).
Background Information for Teachers
This section contains a quick review for teachers of the science and concepts covered in this lesson.What is sound? Sound is produced by vibrations. Musical instruments are objects specifically designed to make beautiful sounds. The key to playing an instrument is to make parts of the instrument vibrate, creating specific sounds. Drummers hit a drum to make its membrane vibrate; an oboe player blows into a reed, causing it to vibrate; and a guitar player plucks a string to make it vibrate. All these vibrations are translated into sounds that we can hear with our ears.
The energy that you put into a guitar string by plucking it travels through the string as a transverse wave. These waves are similar to those you can see in a rope that you swing up and down. Transverse waves (in contrast to longitudinal waves) are characterized by the particle motion being perpendicular to the direction of wave propagation (see Figure 1).
/-/https/www.sciencebuddies.org/cdn/Files/12176/8/transverse-longitudinal-wave-tall.png)
Figure 1. Diagram of a transverse wave (top) and a longitudinal wave (bottom).
However, although you might notice that a guitar string seems to vibrate back and forth in place, the wave does not appear to "travel" down the string. Since the guitar string is fixed at both ends, a transverse wave moving along the string is reflected back when it reaches the end of the string. This results in two transverse waves traveling in opposite directions that combine to form a standing wave, which appears to stand still as shown in Figure 2.
/-/https/www.sciencebuddies.org/cdn/Files/12177/6/animation-standing-wave.gif)
Figure 2. Animation showing how two transverse waves (red and blue) combine to make a standing wave (black).
The transverse wave in the string creates another type of wave by pushing on air molecules. The vibrating motion causes alternating local compressions of the air (increases in pressure) and local rarefactions of the air (decreases in pressure), as shown in Figure 3. Since the air molecules are already in constant motion, the compressions and rarefactions are rapidly transmitted through the air as an expanding wave. This wave is called a sound wave and is a longitudinal wave (see Figures 1 and 3). In a longitudinal wave, the particles of the medium (the material through which the wave passes) move back and forth in a direction parallel to the wave. You can illustrate the compressions and rarefactions of a sound wave in a graph showing pressure versus distance or time. The sound wave in Figure 3 shows how the pressure at a single point in time changes over a distance.
/-/https/www.sciencebuddies.org/cdn/Files/12178/7/transverse-to-sound-wave.png)
Figure 3. Transverse waves (vibrations) of a guitar string create longitudinal sound waves. The sound wave can be represented with dots showing air particles. The dots are closer together in the compressions and farther apart in rarefactions. The sound wave can also be represented using a graph with pressure on the y-axis and distance on the x-axis, where a positive y-axis value corresponds to higher pressure (compression) and a negative y-axis value corresponds to lower pressure (rarefaction). Both methods represent the wave at a single snapshot in time.
Our ears translate sound waves into sounds that we can hear when the waves reach our eardrums, as shown in Figure 4. The sound waves cause the bones in our middle ear to vibrate, and the vibrations are transmitted to fluid in our inner ear. Then, the vibrations travel to the inner ear hair cells and to the nerves that carry the signal to our brains.
/-/https/www.sciencebuddies.org/cdn/Files/12179/11/hearing-sounds.jpg)
When sound waves enter a human ear they travel past the outer ear until they hit the ear drum. The ear drum vibrates air trapped in the inner ear and a nerve sends a signal to the brain which can decipher the vibrations as different sounds.
Figure 4. Our ear translates sound waves into a sound that we can hear.
This explains how we can hear sounds, but it does not explain why there are so many different sounds with various pitches and volumes. To answer this question, we have to look into the properties of transverse and longitudinal waves in more detail. One way to describe a wave is by its speed. In addition to speed, you can describe waves by their frequency, period, and amplitude. Let's start with frequency (f). The frequency of a wave describes how many cycles of the wave occur per unit of time. Frequency is measured in Hertz (Hz), which is the number of cycles per second. Figure 5 (on the left) illustrates examples of waves of two different frequencies. Note that the graphs in this figure show time on the x-axis, not distance as in Figure 3. These graphs show how the pressure at a single point in space (a fixed distance) changes over time.
/-/https/www.sciencebuddies.org/cdn/Files/12180/10/amplitude-frequency.png)
Diagrams showing the impact of sound wave frequency and amplitude on pitch and volume of sound. The diagram on the left shows the impact of frequency on pitch-- as low frequency waves produce lower pitch sounds, while high frequency waves produce higher pitch sounds. The diagram on the right shows the impact of amplitude on volume-- as lower amplitude waves produce quieter sounds while higher amplitude waves produce louder sounds.
Figure 5. Illustration of waves with different frequencies (left) and amplitudes (right), representing sound waves of different pitches and volumes respectively.
Figure 5 also shows the period (T) of the wave, which is the time it takes for one complete wave to pass a given point. The period is simply the reciprocal of the frequency (T = 1/f). Finally, the amplitude of a wave is the distance from the center line to the top of the peak or the bottom of the trough and can have different units dependent on the type of the wave (e.g., for a transverse wave in a rope, this distance would be measured in meters; for a sound wave, this distance is measured in units of pressure). The amount of energy carried by a wave is proportional to the square of the amplitude of the wave. This means that if the height of the amplitude doubles, the wave will have four times the energy. You can see this when generating a transverse wave in a rope: the more you move your arms up and down, the more energy it takes, and the higher your waves will get. Even though their units are different, the amplitude of the transverse wave that creates a sound is directly related to the amplitude of the resulting sound wave.
For a sound wave, the amplitude is connected to the loudness of the sound you hear. Figure 5 (on the right) shows examples of waves with two different amplitudes. The higher the amplitude, the louder the sound. The intensity of sound is measured in decibels (dB). Figure 6 shows the decibel ratings of some common sounds. Decibels are a logarithmic scale, not a linear scale. This means that for every increase of 10 dB, the sound intensity increases by a factor of 10. For example, sound with an intensity of 40 dB is 100 times as intense as 20 dB, not twice as intense. However, while we may use the terms interchangeably in everyday speech, loudness and intensity are not the same thing. (See this link for a more detailed explanation). Most of us perceive a sound to be "twice as loud" as another one when they are about 10 dB apart. Sound levels above 80 dB can cause hearing damage over long periods of time, and sound levels above 120 dB can cause immediate damage.
/-/https/www.sciencebuddies.org/cdn/Files/12181/6/decibel-graph.png)
A bar graph measures common sounds in terms of decibel levels from the loudest at the top to the softest at the bottom. A gunshot is the loudest common sound with a value of 140 decibels, a normal conversation has a value in the middle of the graph of 60 decibels, and the sound of breathing is the quietest with a value of 10 decibels.
Figure 6. Decibel levels of some common sounds. Remember that the decibel scale is nonlinear. Every increase of 10 dB corresponds to roughly doubling the perceived loudness of the sound. So, for example, a chainsaw (100 dB) does not sound twice as loud as moderate rainfall (50 dB); it sounds 32 times as loud!
The pitch of a sound, on the other hand, is determined by the frequency of a sound wave. The frequency of the transverse wave that creates a sound wave is always the same as the frequency of the resulting sound wave. The higher the frequency, the higher the perceived pitch. On average, the frequency range for human hearing is from 20 Hz at the low end to 20,000 Hz at the high end.
In this lesson plan, your students will investigate how the frequency and amplitude of a wave are related to the pitch and volume of a sound by making music with a rubber band guitar. To do this, they will use an app on their phones, which uses sensors that are built into many smartphones, including a microphone that you can use to measure sound. The app helps your students to record and visualize the pitch and sound intensity of the sounds they create with their instruments, allowing them to discover the relationship between the properties of the sound waves and what they hear themselves.
Additional Background Links
- Properties of Waves, Ducksters.com
- Physics of Sound, the Method Behind The Music
- Wave on a String, Phet Interactive Simulations
- Standing Waves, The Physics Hypertextbook
- Why do guitar string look so wibbly-wobbly in smartphone videos?, The Washington Post
- The science of making musical instruments, Open Learn
- Fundamental Frequency and Harmonics, The Physics Classroom
- Loudness, HyperPhysics
Prep Work (15 minutes)
- If you are using cardboard boxes, use a box cutter to cut a hole in the top, and tape the lid flaps shut, as shown in Figure 7.
/-/https/www.sciencebuddies.org/cdn/Files/12182/8/cut-box.jpg)
Figure 7. Prepared box for the rubber band guitar.
- Make sure you are familiar with the sensor app you are using before you show it to your students. The best way to do this is to play with the app on your phone to get comfortable enough using it to explain it to your students. Ideally, you want to test the experiment yourself with the app before class to make sure it works as intended.
/-/https/i.ytimg.com/vi/3cpZEVSC6Nw/maxresdefault.jpg)
/-/https/www.sciencebuddies.org/cdn/Files/20511/4/google-classroom.png)
/-/https/www.sciencebuddies.org/cdn/Files/20512/4/ms-teams.png)
/-/https/www.sciencebuddies.org/cdn/Files/20469/4/Canvas_Bug_Color_RGB.png)
/-/https/www.sciencebuddies.org/cdn/Files/20470/5/Schoology-Logo.png)
/-/https/www.sciencebuddies.org/cdn/Files/20471/4/lms.png)
/-/https/www.sciencebuddies.org/cdn/Files/20469/4/Canvas_Bug_Color_RGB.png)
/-/https/www.sciencebuddies.org/cdn/Files/20470/5/Schoology-Logo.png)
/-/https/www.sciencebuddies.org/cdn/Files/20471/4/lms.png)
Teacher Tool Box
Engage (15 minutes)
- Play a piece of music that includes some instruments/voices with varying pitch and volume. Let the students listen to the music and then ask them:
 What did you just hear?
 Students probably answer: music or name the piece of music you played.Can you tell what music is made of?Music is composed of sounds that are generated by different instruments or a person. Each sound the instrument makes creates a musical note. These notes can sound very different depending on their loudness and pitch. They can, for example, sound high, low, loud, or quiet. Music is made of many different notes played together to create a melody that makes a song recognizable.
 - Let your class make some music themselves! Ask your students to all make random sounds for about 10 seconds at the same time. Point out that the combination of all these sounds probably do not sound like nice music! To create music that sounds pleasing to us, the combined sounds have to be carefully planned by a musician. Wait until it is quiet again and then ask:
How did you create your sound? What do you have to do to make a sound?Let your students explain how they made their sound. Most likely they hit on something or used their voice.
- Explain to your students that all sounds have one thing in common:
they were created by a vibrating object (vocal cords in the case of using their voice, or vibrations of an object that has been hit). Provide examples of how vibrations create sound in musical instruments by showing these videos and let the students describe what they see:
- the membrane on top of a drum vibrating
- guitar strings swinging/vibrating while playing:
How do the drum and the guitar make music? Did you see which parts of the instruments are vibrating to create a sound?When you hit the drum, the membrane is vibrating, which creates the sound. With the guitar, the individual strings are vibrating every time they are plucked. The vibrations cause the sound. - the membrane on top of a drum vibrating
- Tell your students that in the following lesson they will investigate how to make different sounds in more detail and will use guitar strings as an example.
/-/https/i.ytimg.com/vi/tM8WyhB6zYo/maxresdefault.jpg)
/-/https/i.ytimg.com/vi/hvl3ZCIzEK0/hqdefault.jpg)
/-/https/i.ytimg.com/vi/eFXFkgqYkck/hqdefault.jpg)
Explore (60 minutes)
/-/https/www.sciencebuddies.org/cdn/Files/14174/23/note-question-mark-30.png) | From watching the video with the guitar strings, can you tell what the guitar string looked like while vibrating? Can you draw a picture of the vibrating guitar string? What does that pattern remind you of? |
/-/https/www.sciencebuddies.org/cdn/Files/14175/24/conversation-bubbles-30.png) | Students should draw some kind of wave form. The vibrating string pattern looks like a wave. |
- Explain that when plucking the guitar string, you put energy into the string, which then travels through the string as a transverse wave. These waves are similar to the waves that you can see in a rope that you swing up and down or left and right. A wave is characterized by a repeating pattern of peaks at the top and troughs at the bottom.
- Note: before continuing this lesson, your students should be familiar with the terms
frequency and amplitude
and what they mean in the context of waves. If your students have not been introduced to these terms yet, you can do a quick demonstration:
- Ask two students to hold a rope or a Slinky, one on each end.
- Tell one student to move the hand holding the rope or Slinky up and down. As they move their hand farther, the waves should get taller—the amplitude increases.
- Now tell them to move their hand up and down faster but try to keep the amplitude about the same. There should be more waves generated per second—the frequency increases.
- Then ask some students to draw the waves that they saw on the blackboard (e.g. high versus low amplitude and high versus low frequency, similar to Figure 5 in the background section).
- With the help of the students, label the relevant wave characteristics for the waves that have been drawn on the black board and explain these terms in more detail. Make sure to include amplitude, frequency and the wave period (inverse of the frequency) as well as their respective units. Explain that one Hertz is equal to one wave per second and show an example of such a wave on the black board.
Does anyone know how the vibrating guitar string creates a sound that we can hear with our ears?Students might know that the vibrations of the string cause sound waves that travel through the air from the object to our ears. The ears then translate these sound waves into a sound that we hear.
- Explain what sound waves are: the energy from the vibrating object is transferred to the air particles next to the object, which causes these air particles to vibrate. The vibrations then spread to the surrounding air, creating a longitudinal wave. A longitudinal wave is a wave in which the medium (in this case, air) vibrates back and forth parallel to the direction that the waves travel. You can demonstrate longitudinal waves with a Slinky (pull the ends back and forth horizontally instead of moving it up and down), or show this video:
Do you think every vibration creates the same sound wave, or the same sound? How do you think the properties of the transverse wave in the string are related to the resulting sound wave it creates? Does the frequency or amplitude of the wave change the sound we hear?
- Tell your students that they will do an experiment to find out. They will create their own instruments to explore how changing the frequency and amplitude of a wave affects the sound they hear. Let them write down their hypotheses in their worksheets.
- Before you start with the activity, divide your class into groups of 2–3 students and tell them that during their experiment they will be able to measure and record the frequency and sound intensity of the sound they create with their instrument using a cell phone and a sensor app on their phones.
- Explain that the app measures sound intensity (audio amplitude) in decibels. Explain that if the number of decibels doubles, the loudness more than doubles. Every increase of 10 dB corresponds to roughly doubling the perceived loudness of the sound. So, for example, a chainsaw (100 dB) does not sound twice as loud as moderate rainfall (50 dB)—it sounds 32 times as loud! The frequency of the sound is measured in Hertz (Hz).
- Introduce the sensor app to your students, specifically the sound sensor (audio amplitude in phyphox) and pitch sensor (frequency history in phyphox). Remember that when using the phyphox app you will have to calibrate the audio amplitude sensor together with your students before they do any measurements. Do this calibration together as a class before you start your investigations, so each device has comparable sensor readings. Remind students that they will have to re-calibrate their audio amplitude sensor every time they start a new recording! Then ask them to:
- Open the sensor app on their phone.
- Let them choose the sound intensity sensor (audio amplitude in phyphox) and the pitch sensor (frequency history in phyphox). Note that when using the phyphox app students will need to test both sensors sequentially as the app does not allow to make measurements with multiple sensors at the same time. Make sure that your students know where the microphone is located on their phone and let them do a quick test to see if the sound measurements are working. For example, they could record themselves clapping or singing to check if the sensors behave as expected. Remember that when using the phyphox app you will have to calibrate the audio amplitude sensor together with your students before they do any measurements.
- Tell your students that
for their investigations, they will build a rubber band guitar to generate sound waves with a rubber band
similar to strings on a guitar. Give instructions on how they will use a rubber band, a box (with a hole) and two pens to create a "rubber band guitar" as shown in Figure 8:
- Stretch the rubber band around the tissue box (or cardboard box), so it goes across the opening at the top.
- Place one pencil/crayon/marker under the rubber band on each side of the hole.
/-/https/i.ytimg.com/vi/27a26e2CnuM/hqdefault.jpg)
/-/https/www.sciencebuddies.org/cdn/Files/12183/6/rubber-band-guitar.jpg)
Figure 8. A rubber band guitar.
- Make sure each group is spaced out in the classroom with their individual phones close to their rubber band to minimize sound interference between groups. Also, point out that they have to be quiet during their experiments as any noise will be recorded with the phyphox app.
- Tell each group to play with their guitar. Ask them to
use the sensor app to first measure and record the sound intensity and then the frequency of the sounds
they create. When measuring the frequency of their sounds, tell students that they might have to pluck their guitar string several times to get a good sensor reading as each individual pluck is shown as only one single point in the graph. Remind them to save their recordings so they can review and analyze their data later. They will also have to make sure their sensor is still calibrated or have to re-calibrate the sensor before each recording. Tell your students to
analyze and interpret their data
according to the instructions in their
worksheet to answer following questions:
- How can you change the frequency of the sound you measure?
- How can you change the amplitude of the transverse wave in the rubber band?
- How does the amplitude of the transverse wave in the rubber band relate to the sound intensity that you measure?
- How does changing the wave frequency change the sound you hear?
- How does changing the wave amplitude change the sound you hear?
If students struggle with this task, you might need to provide some prompts, such as:
- What wave property changes if you pluck the rubber band harder?
- What happens if you move the two markers farther apart or closer together?
Reflect (25 minutes)
- After 15 minutes, tell all groups to stop their investigations. Ask your students to analyze their data following the instructions in their worksheet. They should graph their data in the template graphs provided.
- Then start a
class discussion based on their generated data
and graphs.
How were you able to change the amplitude of the rubber band vibration?You change the amplitude of the rubber band vibration by stretching the rubber band more when plucking it. The more you stretch the rubber band, the more energy you put into the wave, making it vibrate with a higher amplitude.
- Do a quick demonstration with a rubber band to show how the amplitude changes by stretching the rubber band further out.
What effect does a larger amplitude in the rubber band vibration have on the sound wave it creates?Pulling the rubber band further out and increasing the amplitude of the rubber band vibration creates a bigger disturbance in the air (larger compression of air particles), leading to a larger amplitude of the sound wave. The amplitude of the rubber band vibration and the sound wave are directly related, although they are measured in different units.When you changed the amplitude of the sound wave, how did the sound of the rubber band change? Can you show data that supports your claim?A sound wave with a higher amplitude results in a sound with a higher sound intensity, meaning that the sound gets louder. The students' data and graphs should clearly show that you get higher sound intensities when you stretch the rubber band more, as shown in Figure 9. At the same time, the frequency (pitch) of the sound does not change if you pluck the rubber band harder; it always stays the same.
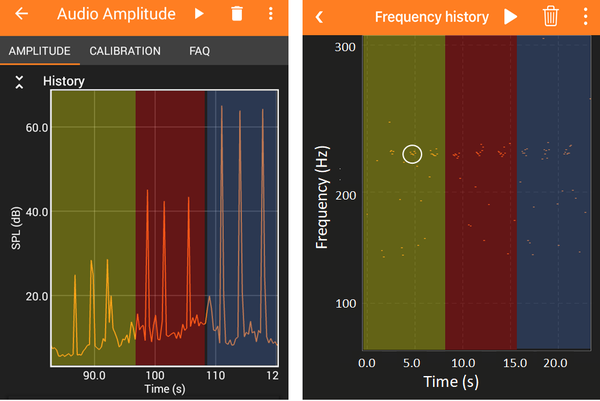
Two graphs demonstrating changes in sound intensity and pitch of sound produced by a homemade instrument. The sound intensity graph gradually increases as the instrument becomes louder. The pitch graph remains constant because the homemade instrument is only able to play a single note.
Figure 9. Example data from the phyphox app demonstrating how the sound intensity changes when you pluck the rubber band harder (left), but the pitch stays the same (right). The rubber band was plucked nine times total (three times at each intensity, shaded in light yellow, red, and blue). The white circle in the right graph highlights the frequency for one time the rubber band was plucked. The x-axes of the graphs are the time in seconds [s], while the y-axis (left) shows sound intensity in decibels [dB], and the y-axis (right) shows pitch or frequency in Hertz (Hz).
How were you able to change the frequency of the sound you measured with the phyphox app?With only one rubber band available, one way of changing the frequency is changing the length of the part of the rubber band that is vibrating. This can be achieved by putting the pens closer to each other or farther apart. Although this does not change the total length of the rubber band, it will change the length of the rubber band part that is vibrating between the pens.What effect does a higher frequency of the rubber band vibration have on the sound wave it creates?Every movement of the rubber band (or string) will make the surrounding air molecules move to create a longitudinal pressure wave, which is the sound wave. This means that the frequencies of both waves are exactly the same.How did changing the wave frequency affect the sound of the rubber band? Can you show data that supports your claim?The frequency of the sound wave determines the pitch of the sound. The graphs recorded with the app should clearly show that shorter vibrating strings have a higher frequency and therefore a higher pitch as shown in Figure 10, whereas the sound intensity does not change significantly as long as the rubber band is plucked the same way.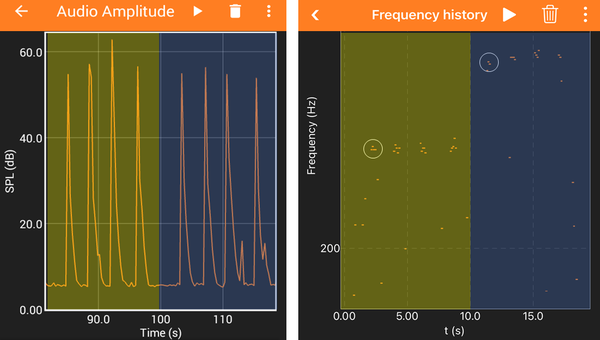
Two graphs demonstrating changes in sound intensity and pitch of sound produced by a homemade instrument. The sound intensity graph remains constant when the instrument is played at the same volume. The pitch graph increases after 4 notes when the length of a rubber band is changed which produces a higher pitched note.
Figure 10. Example data from the phyphox app demonstrating how the pitch or frequency of a sound changes when you change the length of the rubber band (right), but the sound intensity stays roughly the same (if you pluck the rubber band the same) (left). In this graph, the rubber band was plucked 8 times total (four times at each rubber band length, shaded in yellow and blue). The pens were moved closer together in the blue area of the graph. The white circles in the right graph highlight the frequencies for one time the rubber band was plucked. The x-axes of the graphs are the time in seconds [s], while the y-axis (left) shows sound intensity in decibels [dB], and the y-axis (right) shows pitch or frequency in Hertz (Hz).
- Come back to the original question and explain to your students that this correlation (frequency - pitch) allows musicians to play many different notes. When a musician presses a finger on a string of a stringed instrument, the string's length becomes shorter. In a wind instrument, the frequency of the wave can be changed by shortening the air column of the instrument (shorter - higher pitch, longer - lower pitch). Adding several sounds and pitches from several strings on the same guitar can generate a whole piece of music.
- You can end the lesson by playing a piece of music again that demonstrates all the concepts that the students learned in the lesson. The video below is one option.
/-/https/www.sciencebuddies.org/cdn/Files/12184/11/example-data-amplitude-change.png)
/-/https/www.sciencebuddies.org/cdn/Files/12185/11/example-data-frequency-change.png)
/-/https/i.ytimg.com/vi/Ql-ESi7T3po/maxresdefault.jpg)
Assess
You can use this quiz to assess student learning after the activity:
- Online quiz, assignable in any LMS
- Quiz (pdf) and answer key (PDF)
Make Career Connections
Discussing or reading about these careers can help students make important connections between the in-class lesson and STEM job opportunities in the real world.
/-/https/careerdiscovery.sciencebuddies.org/cdn/Files/922/17/iStock-1024627056.jpg)

/-/https/careerdiscovery.sciencebuddies.org/cdn/Files/928/17/ThomasWallner.jpg)
Lesson Plan Variations
- Ask your students to apply what they just learned to build a musical instrument out of some materials you provide. Ask each group to present their instrument and show how it is able to generate different pitches and different sound intensities. Some instrument ideas include a straw flute, a drum of cups, or a full rubber band guitar.
- Explore the relationship between wave frequency and sound pitch in more detail. Let the students investigate the exact correlation of vibrating rubber band length (the distance between the two pens) and the frequency of the resulting sound. Ask them to double or halve the distance between their pens, and measure the frequency of the sound. Students should observe that the fundamental frequency is inversely proportional to the length of the rubber band, which means that if you double the distance between the pens, the frequency will be cut in half.
- If you want to dive deeper into wave characteristics and music, you could expand this lesson plan by discussing natural frequencies of a guitar string, resonance vibrations, and standing wave patterns, which lead to the harmonic series.
/-/https/img.youtube.com/vi/yGHZyY2HPvE/0.jpg)
/-/https/img.youtube.com/vi/gMVVWLgIZDQ/0.jpg)
/-/https/img.youtube.com/vi/D3gCs8A9dXI/0.jpg)