Using the Solar & Heliospheric Observatory Satellite (SOHO) to Measure the Motion of a Coronal Mass Ejection
Abstract
The sun sometimes releases huge bursts of electrified gases into space. These bursts are called coronal mass ejections (or CMEs). When CMEs are directed towards Earth they can generate auroras, the spectacular atmospheric displays also known as "northern lights" (photo by Chris VenHaus, 2001). In this project you'll use images from the SOHO satellite to measure how fast CMEs move.Summary
Sources
This project is based on:- ESA & NASA, 2006. Measuring the Motion of a Coronal Mass Ejection, European Space Agency and NASA (National Aeronautics and Space Agency). Retrieved January 8, 2006.
/-/https/www.sciencebuddies.org/cdn/Files/2778/5/Astro_img086.jpg)
Objective
The goal of this project is to use image data from the Solar & Heliospheric Observatory Satellite (SOHO) to measure the motion of a coronal mass ejection.Introduction
| Before You Start: The sun has periods of increased, solar maximum, and decreased, solar minimum, sunspot activity. This 11-year cycle has effects on many types of space weather. Before starting this experiment you should read a bit about the sunspot cycle and determine where we currently are in the cycle. During a solar minimum you may need to rely on historical data (which we tell you how to obtain in the Experimental Procedure) to complete this project. |
You know that the sun is the ultimate source of energy for most life on earth. Sunlight warms the atmosphere and supplies the energy that plants use to grow. Did you also know that the sun sometimes releases huge bursts of electrified gases into space? These bursts are called coronal mass ejections (or CMEs). When CMEs are directed towards Earth they can generate auroras, the spectacular atmospheric displays also known as "northern lights" (see Figure 1).
/-/https/www.sciencebuddies.org/cdn/Files/2778/5/Astro_img086.jpg)
Figure 1. An example of an aurora photographed in northern Wisconsin, November 20, 2001 by Chris VenHaus (used with permission, Copyright Chris VenHaus, 2001).
CMEs can not only put on a spectacular light show, they can also wreak havoc with earth-orbiting satellites and sometimes even ground-based electrical systems. To understand how they can cause such widespread damage, here are some basic facts of solar physics from a NASA press release to help put things in perspective (NASA, 2003).
"At over 1.4 million kilometers (869,919 miles) wide, the Sun contains 99.86 percent of the mass of the entire solar system: well over a million Earths could fit inside its bulk. The total energy radiated by the Sun averages 383 billion trillion kilowatts, the equivalent of the energy generated by 100 billion tons of TNT exploding each and every second.
But the energy released by the Sun is not always constant. Close inspection of the Sun's surface reveals a turbulent tangle of magnetic fields and boiling arc-shaped clouds of hot plasma dappled by dark, roving sunspots.
Once in a while—exactly when scientists still cannot predict—an event occurs on the surface of the Sun that releases a tremendous amount of energy in the form of a solar flare or a coronal mass ejection, an explosive burst of very hot, electrified gases with a mass that can surpass that of Mount Everest." (NASA, 2003)
To understand where CMEs originate, you should do background research on the structure of the sun. The layers of the sun are illustrated in Figure 2 (ESA & NASA, 2007a).
/-/https/www.sciencebuddies.org/cdn/Files/2777/3/Astro_img076.gif)
Diagram shows slices and cross-sections of the interior and surface of the sun. The inner regions of the sun are the innermost core, radiative and convective zones. The diagram also shows prominence, flare, corona, chromosphere, coronal hole, photosphere and sunspots on the surface and above the surface of the sun.
Figure 2. The layers of the sun (ESA & NASA, 2007a).
CMEs were discovered in the early 1970's, although their existence had been suspected for a long time before that (Howard, 2006). The Solar and Heliospheric Observatory (SOHO) satellite, a project of international cooperation between ESA and NASA, has been observing the sun in unprecedented detail since its launch in 1995.
One of the instrument sets aboard SOHO is the Large Angle and Spectrometric Coronagraph (LASCO). "A coronagraph is a telescope that is designed to block light coming from the solar disk, in order to see the extremely faint emission from the region around the sun, called the corona." (LASCO, date unknown). The LASCO instrument is actually three separate coronagraphs (called C1, C2, and C3). Each of the coronagraphs has a different field of view, ranging from 3 to 30 solar radii (one solar radius is about 700,000 km, or 420,000 miles).- The C3 coronagraph images the corona from about 3.5 to 30 solar radii.
- The C2 coronagraph images the corona from about 1.5 to 6 solar radii.
- The C1 coronagraph operated for only the first two and half years after SOHO was launched. During that time, it imaged the corona from 1.1 to 3 solar radii.
In this project, you will use data from the C2 and/or C3 coronagraphs to measure the motion of CMEs as they leave the sun.
Terms and Concepts
To do this project, you should do research that enables you to understand the following terms and concepts:- Coordinated universal time (UTC)
- Basic facts about the sun (size, distance from earth, temperature)
- Solar sunspot cycle
- Parts of the sun:
- Core
- Radiative zone
- Convective zone
- Chromosphere
- Photosphere
- Corona
- Coronagraph
- Magnetic fields
Questions
- Where in space is the Solar & Heliospheric Observatory (SOHO) satellite?
- What is the Large Angle and Spectrometric Coronagraph (LASCO) instrument on SOHO?
Bibliography
- These links from the SOHO site will be helpful:
- ESA & NASA. (2007a). Our Star the Sun, European Space Agency and National Aeronautics and Space Administration. Retrieved January 8, 2007.
- ESA & NASA. (2007b). SOHO Glossary for Middle School, European Space Agency and National Aeronautics and Space Administration. Retrieved January 8, 2007.
- ESA & NASA. (2007c). SOHO Glossary, European Space Agency and National Aeronautics and Space Administration. Retrieved January 8, 2007.
- ESA & NASA. (2007d). Solar and Heliospheric Observatory (SOHO) Homepage, European Space Agency and National Aeronautics and Space Administration. Retrieved January 8, 2007.
- ESA & NASA. (2007e). SOHO Pick of the Week: CMEs Movin' Out, January 5, 2007, European Space Agency and NASA (National Aeronautics and Space Agency). Retrieved January 19, 2007.
- ESA & NASA. (200). Measuring the Motion of a Coronal Mass Ejection, European Space Agency and NASA (National Aeronautics and Space Agency). Retrieved January 8, 2007.
- For more information on coronal mass ejections (and solar physics in general), see these webpages:
- Hathaway, David H. (2006). Solar Physics: Coronal Mass Ejections, Marshall Space Flight Center, National Aeronautics and Space Administration. Retrieved January 8, 2007.
- Howard, R.A. (2006). A Historical Perspective on Coronal Mass Ejections. E.O. Hulburt Center for Space Research, Washington, D.C. Retrieved July 10, 2020.
- For information about the LASCO instruments on SOHO, see:
LASCO. (n.d.). Large Angle and Spectrometric Coronagraph Experiment (LASCO) Office of Naval Research, U.S. Navy. Retrieved Marach 26, 2024. - This CME catalog is generated and maintained at the CDAW Data Center by NASA and The Catholic University of America in cooperation with the Naval Research Laboratory. SOHO is a project of international cooperation between ESA and NASA.
Yashiro, S., and N. Gopalswamy, 2006. SOHO LASCO CME Catalog, CDAW Data Center. Retrieved January 8, 2007. - For more advanced students, this high school-level physics tutorial has information on kinematics, the physics of velocity and acceleration:
- Henderson, T. (2004). 1-D Kinematics, The Physics Classroom. Retrieved April 18, 2008.
- For more spectacular aurora images, see Chris VenHaus's website:
VenHaus, C. (2001). Chris Venhaus for the DIY Audio Community. Retrieved July 10, 2020.
Materials and Equipment
To do this experiment you will need the following materials and equipment:- Computer with Internet connection and printer
- Ruler
- Calculator
Experimental Procedure
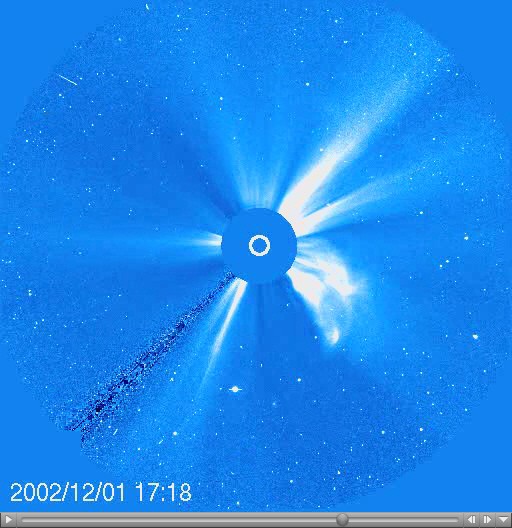
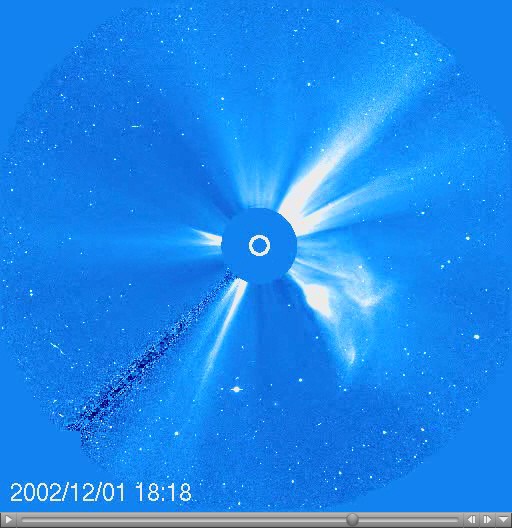
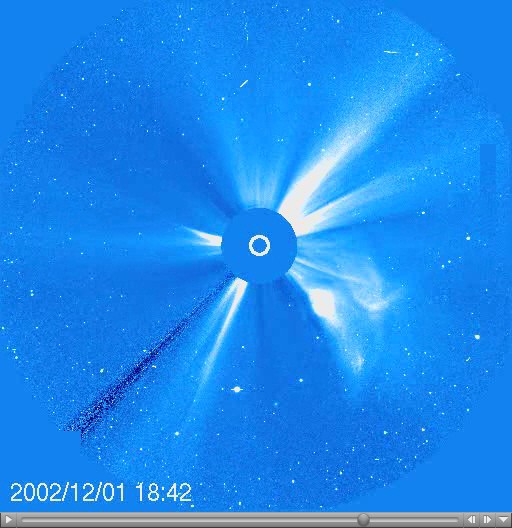
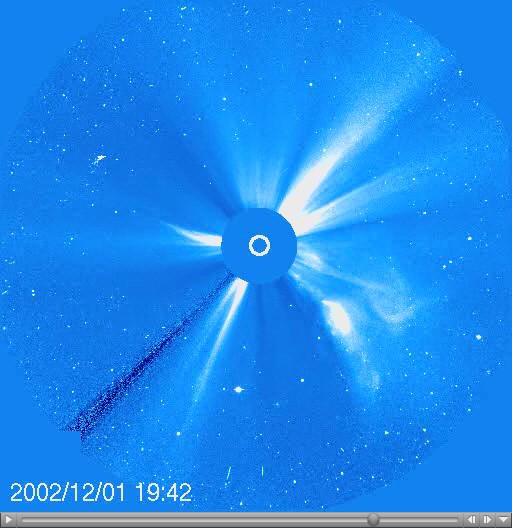
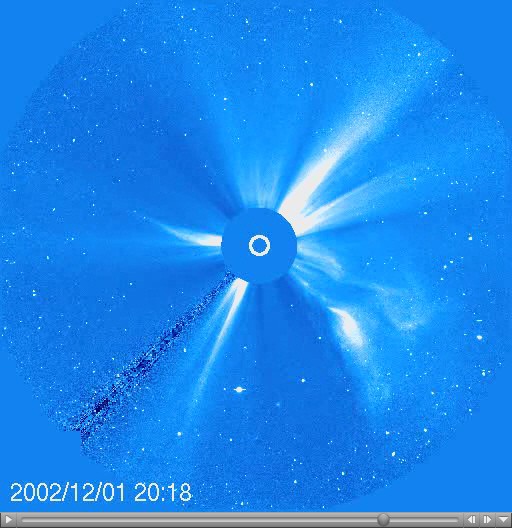
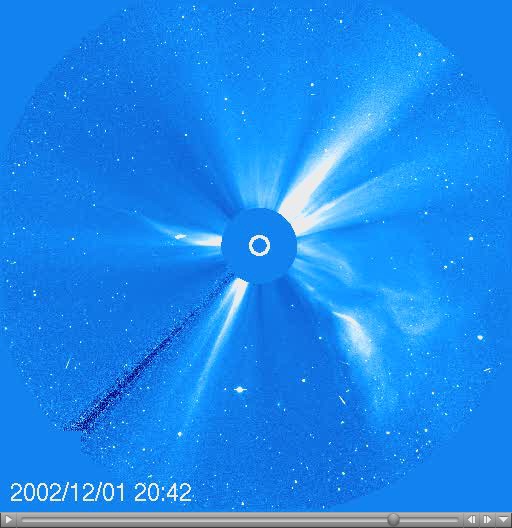
- View the series of five images taken from one of the coronagraphs on LASCO. In each of the images, the white circle shows the size and location of the Sun. The black disk is the occulting disk blocking out the disk of the Sun and the inner corona. The tick marks along the bottom of the image mark off units of the Sun's diameter. To the right of the disk we can see a CME erupting from the Sun.
- Select a feature that you can see in all five images, for instance the outermost extent of the bright structure or the inner edge of the dark loop shape. Measure the position of your selected feature in each image.
- Measurements on the screen or on a printout can be converted to kilometers using the simple ratio:
The diameter of the sun = 1.4 x 10⁶ km (1.4 million km).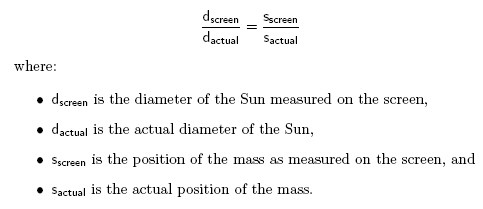
Equation to convert distances in a photo of the Sun into kilometers. The diameter of the Sun (as measured in the photo) divided by the actual diameter of the Sun is equal to the position of the mass (as measured on the screen), divided by the actual position of the mass.
- From the position and time data, you can calculate the average velocity of the feature in a time interval [t1,t2] . Velocity tells you how fast the feature is moving, and is defined as the rate of change of position. The average velocity, v, between successive time points can be calculated using the following equation:
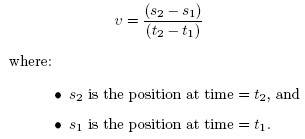
An equation to calculate the average velocity of an object that is photographed at two different times. The velocity is equal to the difference in position, divided by the difference in time between the two photos.
You can assign the average velocity to any point in the interval [t1,t2] but need to be consistent with your choices. For example, you could assign the average value to the start point t1, so the average velocity listed above becomes v1. The average velocity calculated over the next time interval will then be associated to the point in time t2 and becomes v2, etc. With this choice, you cannot calculate an average velocity for the last point in time. You can leave this cell in your data table blank. - From the velocity and time data, you can calculate the average acceleration of the feature. The acceleration tells you how quickly the velocity of the feature is changing over time. The average acceleration between successive time points can be calculated using the following equation:
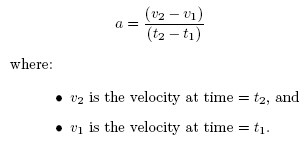
An equation to calculate the average acceleration of an object that is photographed at two different times. The average acceleration is equal to the measured velocity in the second photo minus the measured velocity in the first photo divided by the difference in time between the two photos.
This is again an average. Use the same rule as you used for the average velocity to assign it to a point in time. For example, it you assigned the average velocity to the start point t1, the average acceleration over the interval [t1,t2] must also be assigned to the start point t1. With this choice, you cannot calculate an average acceleration for the last two points in time. You can leave these cells in your data table blank. - For each feature that you measure, record your results in a data table like the following one:
/-/https/www.sciencebuddies.org/cdn/Files/2782/3/Astro_img071.jpg)
/-/https/www.sciencebuddies.org/cdn/Files/2783/3/Astro_img072.jpg)
/-/https/www.sciencebuddies.org/cdn/Files/2784/3/Astro_img073.jpg)
/-/https/www.sciencebuddies.org/cdn/Files/2785/3/Astro_img074.jpg)
/-/https/www.sciencebuddies.org/cdn/Files/2786/3/Astro_img075.jpg)
/-/https/www.sciencebuddies.org/cdn/Files/2779/3/Astro_img068.jpg)
/-/https/www.sciencebuddies.org/cdn/Files/2780/3/Astro_img069.jpg)
/-/https/www.sciencebuddies.org/cdn/Files/2781/3/Astro_img070.jpg)
| Universal Time | Time Interval (t2 − t1) |
Screen Position (sscreen, cm) |
Actual Position (actual, km) |
Average Velocity | Average Acceleration |
|---|---|---|---|---|---|
| 08:05 | |||||
| 08:36 | |||||
| 09:27 | |||||
| 10:25 | |||||
| 11:23 |
- Select another feature, measure its position in all of the images, and calculate its velocity and acceleration.
- Are the velocity and acceleration the same or different from those for the first feature you selected?
- Which velocity and acceleration measurements are "right"?
- Scientists often look at a number of points in different parts of the CME to get an overall idea of what is happening.
- Repeat the measurements on image sequences from other CMEs. An online catalog of CME movies is available (Yashiro, S., and N. Gopalswamy, 2006). The following brief instructions describe how to obtain and use images from the catalog.
- Click on a month from the table (see screenshot).
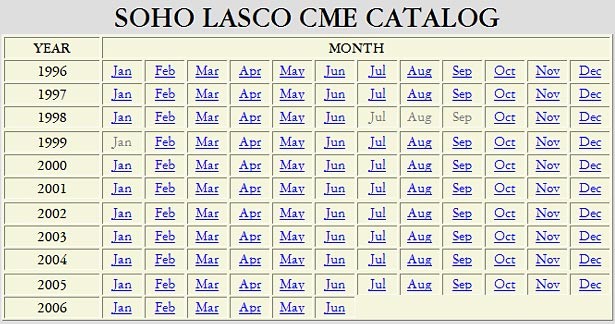
A screenshot of a monthly calendar shows every month between the years 1996 and 2018 on the website cdaw.gsfc.nasa.gov. The months link to information about coronal mass ejects that have been recorded and published online.
- Scroll through the table of CMEs for the month you chose. Pick a CME that you would like to study further. Click on the 'C3' link in the right-most column.
This will load an MPEG movie in your browser. You'll need to have an MPEG plug-in such as QuickTime or Windows Media Player configured for your browser.
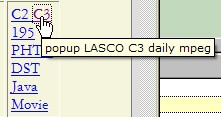
A screenshot of links on the website cdaw.gsfc.nasa.gov shows a link "C3", with a tooltip labeled "popup LASCO C3 daily mpeg". The C3 link will download a video of the CME selected.
- Here is a link to the movie we used for the remaining still images in the project (from December 12, 2002, starting at 00:18, ending at 23:42).
- Play the movie, and identify when the CME occurs. (Note that in some cases there may be multiple CMEs in a single movie.)
- Use the controls of your MPEG player to step through the movie frame-by-frame.
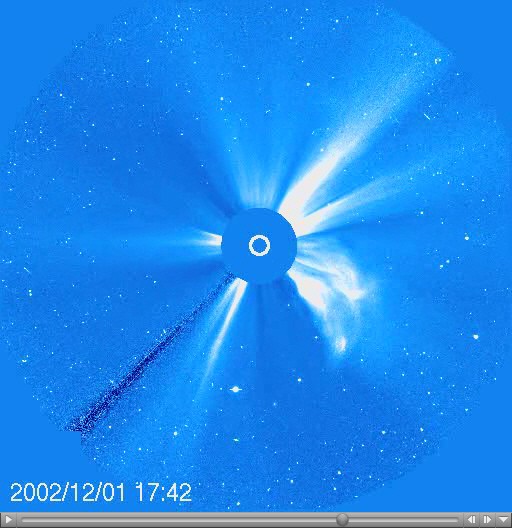
- Save a sequence of 5-10 images that show the evolution of a CME. (To save a single frame, right-click on the image and select 'Save image as...'.) Use these images to make measurements of feature positions, and then calculate the average velocity and average acceleration.
- Note that these images will not have tick marks at the bottom. However, they do still have the diameter of the sun marked (center white ring), which you can use to scale your measurements as before.
- Here is a sample set of seven images from the movie:
- Click on a month from the table (see screenshot).
- Here are some questions to think about when writing up your project. These are important questions in CME research, so you may not be able to answer all (or any) of them, but they are interesting questions to consider!
- Sometimes it can be tough to trace a particular feature. How much error do you think this introduces into your calculations?
- How does the size of the CME change with time?
- What kind of forces do you think might be acting on the CME? How would these account for your data?
/-/https/www.sciencebuddies.org/cdn/Files/2787/3/Astro_img077.jpg)
/-/https/www.sciencebuddies.org/cdn/Files/2788/3/Astro_img078.jpg)
/-/https/www.sciencebuddies.org/cdn/Files/2789/3/Astro_img079.jpg)
/-/https/www.sciencebuddies.org/cdn/Files/2790/3/Astro_img080.jpg)
/-/https/www.sciencebuddies.org/cdn/Files/2791/3/Astro_img081.jpg)
/-/https/www.sciencebuddies.org/cdn/Files/2792/3/Astro_img082.jpg)
/-/https/www.sciencebuddies.org/cdn/Files/2793/3/Astro_img083.jpg)
/-/https/www.sciencebuddies.org/cdn/Files/2794/3/Astro_img084.jpg)
/-/https/www.sciencebuddies.org/cdn/Files/2795/3/Astro_img085.jpg)
Ask an Expert
Global Goals
The United Nations Sustainable Development Goals (UNSDGs) are a blueprint to achieve a better and more sustainable future for all.
/-/https/www.sciencebuddies.org/cdn/Files/19752/5/E-WEB-Goal-09.png)
Variations
- CMEs can disrupt earth-orbiting satellites, and even electrical grids on earth. If the SOHO LASCO instrument can detect earth-directed CMEs as they leave the sun, perhaps the early warning can give scientists and engineers on Earth a chance to take protective measures. From your average velocity calculations, how quickly would you predict the material would reach the Earth? (More advanced students should also include initial acceleration in the calculation.) How does this compare with actual transit times? (You'll need to do background research to find this information.)
- Do background research to find out how long it takes for the material from a CME to reach Earth (only a subset of CMEs are directed Earth-ward). How much variation is there in Sun-to-Earth transit time? Using your measurements of initial velocity and acceleration, estimate how long it would take the ejected material to reach Earth? How do your estimates compare with actual times? How much variation is there in CME velocity and acceleration?
- For related Science Buddies projects, see:
Careers
If you like this project, you might enjoy exploring these related careers:
/-/https/careerdiscovery.sciencebuddies.org/cdn/Files/902/18/iStock-1174945987.jpg)
/-/https/careerdiscovery.sciencebuddies.org/cdn/Files/1442/17/unsplash-TXxiFuQLBKQ.jpg)
/-/https/careerdiscovery.sciencebuddies.org/cdn/Files/1640/26/Fyysikot_tyossaan.jpg)

/-/https/img.youtube.com/vi/67hDDnlqaKc/0.jpg)
/-/https/img.youtube.com/vi/RXVBU4gTPl0/0.jpg)
/-/https/img.youtube.com/vi/QBRy_9f5sps/0.jpg)