Abstract
Expanding gases are everywhere, from the kitchen to the cosmos. You've tasted their pleasures every time you've eaten a slice of bread, bitten into a cookie, or sipped a glass of soda. In this chemistry science fair project, you'll capture a gas in a stretchy container you're probably pretty familiar with—a balloon. This will allow you to observe the gas expansion and contraction as the temperature changes.Summary
Kristin Strong, Science Buddies
Edited by Peter Boretsky, Lockheed Martin
Mylar® is a registered trademark of DuPont Teijin Films./-/https/www.sciencebuddies.org/cdn/Files/3771/5/Chem_img058.jpg)
Objective
To investigate how gases expand and contract with temperature, using latex balloons.
Introduction
Imagine your friend has a cold January birthday and you bundle up and go to the store to buy him a "Happy Birthday" Mylar® balloon. You pick out a plump, cheerful balloon and head back to your car. By the time you get home though, you realize that the balloon you picked out isn't so plump anymore. In fact, it's starting to look a bit limp already! Should you take it back to the store? Is it defective? What's going on?
Everything in the world around you is made up of matter, including the balloon you just bought and what's inside it. Matter comes in four different forms, called states. The states, going (generally) from lowest energy to highest energy are solids, liquids, gases, and plasmas. Gases, like the helium gas inside your balloon, take the shape of the containers that they are in. They spread out so that all the space is filled up evenly with gas molecules. The gas molecules are not connected together. They move in a straight line until they bounce into another gas molecule or hit the wall of the container, and then they rebound and continue off in another direction until they hit something else. The combined motion energy of all of the gas molecules in a container is called the average kinetic energy.
This average kinetic energy (energy of motion) changes in response to temperature. When the temperature increases, the average kinetic energy of the gas molecules also increases. The molecules move faster and have more frequent and harder elastic collisions with the inside of the container. So, when your balloon was in the store, at room temperature, it was plump and full. When the balloon was taken outside into the cold January air, though, the average kinetic energy of the gas molecules was lowered, so the elastic collisions of the molecules with the inside wall of the balloon became less frequent and weaker, making your Mylar balloon saggy.
What do you think would happen if you took a room-temperature balloon and put it inside a car on a hot day? The average kinetic energy of the gas molecules inside would increase, creating more frequent and forceful collisions with the inside walls of the balloon. The balloon would look very puffy and full, and because Mylar balloons are not stretchy and elastic, the balloon might even burst.
In this chemistry science fair project, you'll investigate these changes in average kinetic energy by using a different kind of balloon—a latex balloon, which is able to expand and contract as the force and frequency of the elastic collisions change with temperature.
Terms and Concepts
- Mylar
- Matter
- States (of matter)
- Solid
- Liquid
- Gas
- Plasma
- Molecule
- Average
- Kinetic energy
- Elastic collision
- Latex
- Proportional
- Linear
Questions
- How do gases behave?
- How does temperature affect gas molecules?
- What happens in an elastic collision?
Bibliography
This source describes the different states of matter:
- EdInformatics.com. (1999). States of Matter. Retrieved January 23, 2009.
This source discusses what gases are and how they behave:
- Rader, A. (2007). Looking For a Gas. Retrieved January 23, 2009.
This source provides an interactive tool to investigate what happens when gases are heated and cooled:
- BBC. (n.d.). Gases Around Us. Retrieved January 23, 2009.
This source discusses elastic and inelastic collisions:
- Nave, C. R. (2005). Elastic and Inelastic Collisions. Retrieved January 23, 2009.
This source describes how to turn an expanding balloon into a model of the expanding universe:
- Schlumberger Limited. (2008). The Expanding Balloon. Retrieved January 23, 2009.
For help creating graphs, try this website:
- National Center for Education Statistics, (n.d.). Create a Graph. Retrieved June 25, 2020.
Materials and Equipment
Note: To do this science fair project, you will need to place balloons in areas with three distinctly different temperatures:
- Room temperature
- Hot temperature that is well above room temperature; for example, outdoors on a hot day or inside a car on a hot day.
- Note: Do not put the balloon in direct sunlight or under a heat lamp because this causes the gas to escape from the balloon and will deflate it due to losing gas. This will not let you determine whether the gas contracted or expanded.
- Cold temperature that is well below room temperature; for example, in a freezer, or outdoors on a cold day
To do this science fair project, you will need the following materials:
- Latex balloons, round rather than oblong (1 package; you will only need 3, but should have extra in case any of them pop).
- Note: Larger balloons allow you to see circumference changes more easily, but if you plan to use a freezer for your cold-temperature trials, your balloon must be able to fit in the freezer when inflated, so a small- to medium-sized balloon is a better choice if your freezer is not very large.
- Marker
- Thermometer with a range that spans the temperatures you will be testing (below freezing to well above room temperature) like the thermometer available from Amazon.com.
- Cloth tape measure with millimeter (mm) markings
- Helper
- Clock
- Lab notebook
- Graph paper
Disclaimer: Science Buddies participates in affiliate programs with Home Science Tools®, Amazon.com, Carolina Biological, and Jameco Electronics. Proceeds from the affiliate programs help support Science Buddies, a 501(c)(3) public charity, and keep our resources free for everyone. Our top priority is student learning. If you have any comments (positive or negative) related to purchases you've made for science projects from recommendations on our site, please let us know. Write to us at [email protected].
Experimental Procedure
Preparing for the Balloon Tests
- Blow up one of the balloons until it is quite full, but not close to popping, and tie it off.
- Mark the balloon with the number 1.
-
Measure the circumference of this first balloon with the cloth tape measure, selecting the fullest part of the balloon to measure, as shown in Figure 1 on the right. Hold the tape measure snug on the balloon, but not so tight that the balloon is being squeezed by the tape measure and changing its shape. In your lab notebook, make a data table like Table 1, below, and record this starting circumference in millimeters (mm) in the data table.
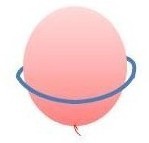
Figure 1. This drawing shows where to measure the circumference of the balloons.
-
Blow up the second balloon so it looks about the size of the first balloon, but do not tie it off yet. Pinch the opening closed between your thumb and finger so the air can not escape. Have your helper measure the circumference of the second balloon, just as you measured the first balloon. Adjust the air in the second balloon until its circumference is within 0.5 cm of the starting circumference of the first balloon, as follows:
- If the circumference of the second balloon is smaller than the starting circumference of the first balloon, then blow up the second balloon some more.
- If the circumference of the second balloon is larger than the starting circumference of the first balloon, then let some air out of the second balloon.
- Tie off the second balloon and mark it with the number 2. Record the balloon's circumference in your data table.
- Repeat step 4 for the third balloon, adjusting the circumference until it is within 0.5 cm of the starting circumference of the first balloon, then tying it off, marking it with the number 3, and recording its circumference in your data table.
/-/https/www.sciencebuddies.org/cdn/Files/3771/5/Chem_img058.jpg)
Table 1: Circumference Data Table
| Temperature (°C) | Balloon 1 Circumference (mm) | Balloon 2 Circumference (mm) | Balloon 3 Circumference (mm) | Average Circumference (mm) | Average Circumference Cubed (mm3) |
Testing Your Balloons at Room Temperature
- Measure the temperature of the room with the thermometer and record your measurement in the data table.
- Measure the circumference of each balloon with the tape measure, selecting the fullest part of each balloon to measure, as shown in Figure 1. Hold the tape measure snug on the balloon, but not so tight that the balloon is being squeezed by the tape measure and changing its shape. Record your measurements in the data table.
Testing Your Balloons in the Cold Area
- Place the thermometer and all three balloons—one at a time, if necessary—in the area where you have chosen to do your cold-temperature testing; such as in the freezer.
- Wait approximately 1 hour. If you can only put one balloon in at a time, this step will take 3 hours.
- Remove the balloon(s) from the freezer and immediately measure the circumference(s) and record your measurements in the data table.
- Record the temperature inside your cold area in the data table.
- Repeat steps 1–3, if necessary, until all three balloons have been tested in the cold area.
Testing Your Balloons in the Hot Area
- Wait 20 minutes to allow your balloons to come to room temperature.
-
Place the thermometer and the balloons—one at a time, if necessary—in the area you have chosen to do your hot-temperature testing; such as inside a car on a hot day.
- Note: Do not put the balloons in direct sunlight or under a heat lamp because this causes the gas to escape from the balloons and will deflate them due to losing gas. This will not let you determine whether the gas contracted or expanded.
- Wait approximately 5–10 minutes, or until you can see obvious changes. If you can only put one balloon in the hot area at a time, this step will take up to 30 minutes.
- Remove the balloon(s) from the hot area and immediately measure the circumference and record your measurements in the data table(s).
- Record the temperature inside your hot area in the data table.
- Repeat steps 1–4, if necessary, until all three balloons have been tested.
Analyzing Your Data Table
- For each temperature, calculate the average circumference and enter your calculations in the data table.
- For each temperature, cube the average circumference by multiplying the average circumference by itself three times. For example, if the average circumference is 60 mm, then the average circumference cubed is 60 X 60 X 60, or 216,000 mm3.
- Plot the temperature on the x-axis (in °C) and the average circumference cubed on the y-axis (in mm3). You can make the line graph by hand or use a website like Create a Graph to make the graph on the computer and print it.
- Assuming the balloon is a sphere, the volume is proportional to the circumference cubed, meaning there is a linear relationship between volume and circumference if you plot them on a graph. In your graph, is there a linear relationship between the circumference cubed and the temperature? If not, was there a greater change in circumference cubed in going from room temperature to a cooler temperature, or in going from room temperature to a warmer temperature? As the temperature increases, what do you think happens to the space between the gas molecules inside the balloon? What do think happens to the space between the gas molecules inside the balloon as the temperature decreases?
Ask an Expert
Variations
- Create a balloon model of the expanding universe. Place three small pieces of masking tape at different locations on a lightly inflated balloon that is clamped shut with a clothespin. Make a dot in the center of each piece of tape and have each one represent a different galaxy. Measure the distance between all the galaxies and the circumference of the balloon. Record the distance between all the galaxies and the circumference of the balloon. Blow up the balloon more, clamp it closed again, and repeat your measurements. Repeat this two more times, adding more air each time. In several graphs, plot the circumference of the balloon on the x-axis and the distances between the galaxies on the y-axis.
- For a similar science project to this one, check out Racing to Win That Checkered Flag: How Do Gases Help?
Careers
If you like this project, you might enjoy exploring these related careers:
/-/https/careerdiscovery.sciencebuddies.org/cdn/Files/1107/19/pexels-photo-3938023.jpg)
/-/https/careerdiscovery.sciencebuddies.org/cdn/Files/1113/21/iStock-498128575.jpg)
/-/https/careerdiscovery.sciencebuddies.org/cdn/Files/1100/18/unsplash-NP6JLl_2C-c.jpg)

/-/https/img.youtube.com/vi/SD6LToUppRk/0.jpg)
/-/https/img.youtube.com/vi/Fql4TeeqYq8/0.jpg)
/-/https/img.youtube.com/vi/-frF3sPyKMI/0.jpg)