Abstract
Do you think artificial intelligence (AI) is too complex to use? Think again! In this project, you will use AI to teach a web-based tool to classify happy and sad faces, or other objects, poses, or sounds. This experiment requires no coding skills; instead, you will need curiosity, creativity, and a critical eye. Why not give it a try yourself?
Summary
None
This project requires access to a computer and the internet. See the materials list for details.
No issues
/-/https/www.sciencebuddies.org/cdn/Files/18180/16/machine-learning-results-thumbnail.png)
Objective
Train a web-based machine learning model to classify pictures, objects, or sounds and see if more learning data leads improves the model's accuracy.
Introduction
/-/https/www.sciencebuddies.org/cdn/Files/18180/16/machine-learning-results-thumbnail.png)
Artificial intelligence (AI) is a branch of computer science that tries to build computer programs that demonstrate intelligence. Machine learning is a sub-division of AI as shown in Figure 1. Its goal is to create programs that can learn and improve over time using data.
/-/https/www.sciencebuddies.org/cdn/Files/18128/19/artificial-intelligence-fields.png)
Figure 1. Machine learning is a branch of artificial intelligence and is part of computer science.
Unlike traditional computer programs where the decisions and rules are designed by humans, machine learning programs can "learn" to make their own decisions from data and feedback. This allows machine learning programs to find trends and patterns in enormous quantities of data, including patterns that are hard for humans to catch. They can also improve themselves without human intervention and can make predictions and handle complex, changing environments.
However, machine learning has its limitations. It requires a neutral and complete set of data to learn from and it uses a lot of computer power. The results need to be taken with some precaution they are susceptible to systematic errors. The video Machine Learning and Human Bias further explains what machine learning is, and how human bias can creep into machine learning tools.
/-/https/i.ytimg.com/vi/59bMh59JQDo/maxresdefault.jpg)
Writing a machine learning program takes dedication and work. Programmers have developed many ways to make machine learning more accessible, and Teachable Machine is one answer to these attempts. Teachable Machine is a web-based tool that allows users to quickly and easily make a train a machine learning model to recognize and classify images, without needing to do any programming yourself. This means users who do not have computer programming experience can still use the power of artificial intelligence.
Google's Teachable Machine uses machine learning to classify images. The user needs to provide training data or examples that are already classified for the model to train itself. This can be sounds, pictures, or video. The next step is to train the model. This means the model tries to find patterns in the data to perform the task the user asked it to do, in this case classifying images. Once trained, users test their model to see how it performs.
This project describes how to use Teachable Machine to classify drawings of happy and sad faces as shown in Figure 2. Classifying drawings according to the emotion they show might feel farfetched; there is however a whole field in computer science that develops AI tools that can capture and analyze human emotions called emotion AI.
If classifying drawings does not excite you, consider classifying other objects, people, sounds, or poses instead.
/-/https/www.sciencebuddies.org/cdn/Files/18126/9/examples-testing-teachable-machine.jpg)
Figure 2. Examples of happy and sad face classifications completed by a computer.
Teachable Machine relies on training data to learn how to classify images. Therefore, it needs a set of examples from each class that will be used. Figure 3 shows an example of training data for a model that will classify drawings of happy and sad faces.
/-/https/www.sciencebuddies.org/cdn/Files/18186/13/faces-10-happy-10-sad-2.png)
Figure 3. A collection of different images that could be used as training data to train a tool to classify happy and sad faces.
Once trained, the user needs to test the performance. A confusion matrix is one way to communicate the performance of a classification model. For a model that classifies drawings as either "Happy" or "Sad" a confusion matrix would look like the one shown in Figure 4.
/-/https/www.sciencebuddies.org/cdn/Files/18185/9/confusion-matrix.png)
Figure 4. A confusion matrix for a tool that classifies drawings in "Happy" and "Sad".
The diagonal, blue squares show how accurate the tool is. The accuracy is how often a tool can correctly perform its task. For example, a tool that classifies 90 out of 100 happy faces as "Happy" has 90% accuracy for happy faces. So the blue square next to "Happy drawing" would have the number 90 written in it. The diagonal, yellow squares show how frequently the tool gets confused, or provides an incorrect answer. In our example, 10 of the 100 happy drawings that were tested were misclassified as "Sad." Thus, the yellow square next to "Happy drawing" would have the number 10. The higher the accuracy and the lower the number of misclassifications, the better the tool is performing.
Users will test if their tool shows AI bias, or a tendency to systematically misclassify. A model might, for example, tend to classify drawings as "Happy" when they are held close to the camera lens, or classify drawings made with a dark pencil as "Sad," no matter how the face looks. These are examples of biased AI tools.
In this project, you will investigate whether or not an AI model's performance changes if you add more training data. Do you think more training data will increase, decrease, or not change the accuracy of your AI tool?
Terms and Concepts
- Artificial intelligence (AI)
- Machine learning
- Teachable machine
- Training data
- Confusion matrix
- Accuracy
- AI bias
Questions
- What helps you decide if a drawing of a face looks happy or sad? Could a computer use the same factors?
- The model will learn from examples of happy and sad faces we provide. Should the examples of happy faces all be identical, or would it be better to have different examples? Must the examples show the facial features that change when one is happy or sad?
- Do you think giving a machine learning model more examples of happy and sad faces to learn from will improve its accuracy? Explain your answer.
Bibliography
- An explanation of what Teachable Machine is and how to use it: Google. (n.d.)Teachable Machine Google. Retrieved November 10, 2021.
- Frequently asked questions about Teachable Machine: Google. (n.d.) Teachable Machine FAQ Google. Retrieved November 10, 2021.
- An explanation of artificial intelligence and machine learning: Raj Shroff. (Sept 25, 2019) Artificial Intelligence Explained in Simple Terms, My-Take. Retrieved November 10, 2021.
Materials and Equipment
- Face template, six copies
- Pencil
- Scissors
- Construction paper
- Coloring pencils, crayons, or markers
- Access to a computer with webcam. [Note: cell phones and tablets will not work.] Instead of a webcam, digital photos can be taken with another device and uploaded.
- Access to the internet, more specifically, the Teachable Machine web page.
- Stuffed animal
Experimental Procedure
Just like little kids learn to distinguish happy from sad faces by seeing examples, Teachable Machine will learn from examples you provide. We will refer to this set of examples as the training data because your model will learn from this set of drawings.
Getting Familiar with Teachable Machine
- Before you start this project, it might be fun and helpful to play with Teachable Machine. Go to the Teachable Machine new project web page and use the webcam to train the model to recognize whether you or a stuffed animal is looking at the camera.
The Teachable Machine Tutorial 1 video explains how to gather training data. Go ahead and gather training data. If your computer does not have a webcam, take digital pictures and upload those to the model instead. Then, watch the Teachable Machine Tutorial 2 video to learn how to train the model.
The Teachable Machine Tutorial 3 video shows how to understand the predictions.
Try these steps to get familiar with Teachable Machine and be sure to watch the tutorials if you get stuck.
Creating Training Data
- Draw examples of happy faces in twenty circles (two sheets of the template) and sad faces in another set of twenty circles (two templates). Always use the same pencil or pen to draw your faces.
- Cut along the lines and make a stack of happy and a stack of sad faces.
- If you do not have a digital camera or scanner you can use the webcam to take pictures in Teachable Machine. This will be explained below.
If you have a digital camera or scanner and can easily transfer the files to the computer:
- For each drawing, place the face on a plain background like a sheet of colored construction paper, as shown in Figure 5. Take a picture or scan. Try your best to take every picture the same way, laying the sad/happy face in the same spot, at the same angle, same distance, etc.
- Transfer the files to the computer. Organize them (by giving them clear filenames or putting them in a folder) so you can clearly identify them as the training data later.
/-/https/www.sciencebuddies.org/cdn/Files/18182/11/pictures-for-learning-data2.jpg)
Figure 5. A drawing that is ready to be photographed (lower right corner), and six drawings that have already been photographed (upper left corner).
Preparing the Model
- Go to the Teachable Machine new project web page for recognizing images.
- Label the classes.
The model will classify drawings of faces into two groups or classes: happy faces and sad faces. Rename class 1 as "Happy" and class 2 as "Sad."
Uploading Training Data
- If you already saved the learning data files to your computer, use the "Upload" button to upload the training data files for happy faces to the "Happy" class, and the training data files for the sad face to the "Sad" class.
- If you will use the webcam in Teachable Machine to take pictures:
- Start the webcam for the "Happy" class by clicking the "Webcam" button.
- Place a happy face drawing on a plain background like a sheet of colored construction paper.
- Hold the drawing close to the lens, so the drawing fills most of the space.
- Take all the pictures with the camera at the same angle so the lighting stays consistent.
- Try to keep your fingers out of the picture. Teachable Machine has a function that crops the pictures as you are taking them. This can help you crop your fingers out of the pictures.
- Repeat step b–e for all happy drawings in your training data. Try your best to take every picture in the same way.
- Once all happy faces of the learning data are uploaded, move on to the "Sad" class, repeat steps b–f for uploading the sad faces learning data. Try your best to take these pictures the same way as you took the happy face pictures.
You now have twenty pictures in the training data for each class. If this is not the case, remove doubles or add pictures where needed.
It is fine if the training data shows some variation in lighting, distance, etc. It is important though that these variations occur in both classes. For example, it is not OK to have all the pictures in the "Happy" class to be close-ups and all the pictures of the "Sad" class to be taken from further away. But having about the same portion of close-ups and pictures taken from further away in both classes is fine.
Training the Model
- Start the model's learning process by clicking on the "Train Model" button. The model should take less than a minute to complete this step. In that time, the model for searches patterns in the training data it can use to distinguish between happy and sad drawings.
Saving the Model
- All the uploaded data on the machine can be saved to Google Drive and later uploaded from the Drive to continue. Look for the commands "Save project to Drive" and "Open project from Drive" under the "Teachable Machine" menu. It will ask you to log in to a Google account to access your Google Drive.
The project can also be saved as a file on your computer and uploaded later. Look for the commands "Download project as file" and "open project from file" under the "Teachable Machine" menu.
Testing the Model
- To see how the model performs, you can use the webcam or files. Figure 6 shows how to toggle between the two.
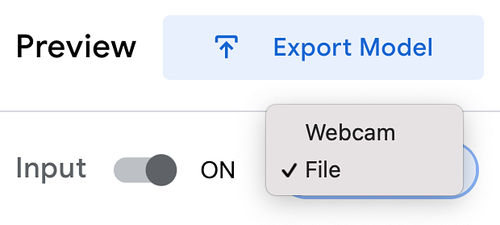
Figure 6. Teachable Machine allows you to use files you upload or the webcam to test the tool.One by one, choose a few happy and a few sad drawings from the training data, and test how the model classifies these drawings.
The bars under the test picture in the "output" box inform you how the model classifies the drawing. Your model will probably classify its training data with high confidence, as shown in the left image of Figure 7 where we see the model is certain the image belongs to the "Happy" class.
Sometimes, the model is not clear about how to classify a drawing. The right image in Figure 7 is an example. The orange bar next to "Happy" shows the model classifies this drawing with a confidence of 59% in the "Happy" class. The red bar next to "Sad" shows it is 41% confident the drawing belongs to the "Sad" class.
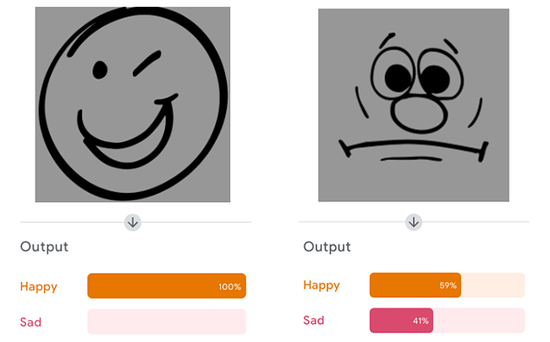
Figure 7. Two examples of an AI tool that learned to classify happy and sad face drawings.In this experiment, you classify a drawing in the class for which the tool shows a confidence of over 50%. With this rule, the picture on the right in Figure 8 is classified under "Happy" because 59 is higher than 50. Because this drawing is in fact a sad face, the tool receives a mark in "Sad drawing misclassified as "Happy."
If you use the webcam, try your best to show the drawings the same way as you took pictures previously.
- In your notebook, draw a confusion matrix like the one shown in Figure 8. Do not forget to fill in the amount of training data you used in the title.
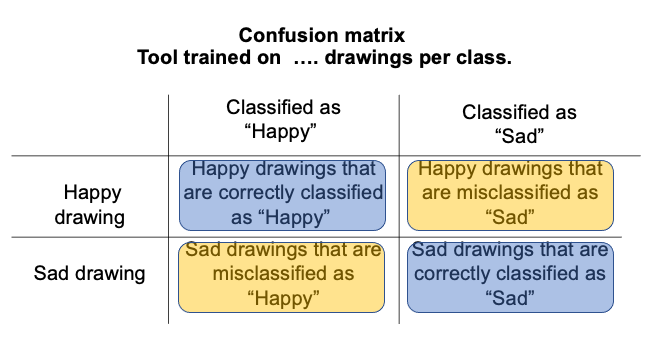
Figure 8. A confusion matrix helps organize the test results.
/-/https/www.sciencebuddies.org/cdn/Files/18184/9/toggle-file-webcam-teachable-machine.png)
/-/https/www.sciencebuddies.org/cdn/Files/18183/9/teachable-machine-test-results.png)
/-/https/www.sciencebuddies.org/cdn/Files/18181/9/confusion-matrix-for-testing.png)
Testing New Data
The real test is seeing how well the tool can classify drawings it has never seen (drawings that were not part of the training data).
- Create five more happy face drawings and five more sad face drawings.
- One at a time, test each new face.
- Record a new confusion matrix. How did your model do with the new faces that were not part of the training data?
Adding More Training Data
You have trained and tested a model that used twenty drawings in each class to learn the difference between a happy and sad face. You will now find out what happens to your model's accuracy if you add more training data.
- Save the model under a new name. This will keep this model separate from the one that was trained with twenty drawings per class. You can update the name of your model by clicking the pencil icon located under the "Teachable Machine" menu.
- Draw 15 more happy faces and 15 more sad faces. Combined with the 5 each that you drew in the previous section, you should now have 20 new faces for each class.
- Using the webcam or file upload feature, add 20 new faces to each one of the classes (the files that you uploaded previously should still be there).
- Re-train the model.
- Re-test the model as you did previously, first with faces that were included in the training data, then with new faces. Record a new confusion matrix each time.
Analyzing the Data
- Compare and contrast the confusion matrices you have. The background section can help you understand the confusion matrix. Remember, blue represents accuracy, yellow represents misclassification. Higher numbers in the blue squares and lower numbers in the yellow squares indicate a better-performing model.
- Did adding more training data improve the accuracy of your model? If not, you can continue to iteratively add more training data, re-test, and re-train the model. Do you reach a point of diminishing returns, where adding more training data does not significantly improve the model's accuracy?
Communicating the Results
- Add pictures of the learning data and classifications of the AI tool you created in your report. Figure 2 and Figure 3 are good examples.
Troubleshooting
For troubleshooting tips, please read our FAQ: Happy or Sad? Use Artificial Intelligence to Classify Faces.
Ask an Expert
Global Goals
The United Nations Sustainable Development Goals (UNSDGs) are a blueprint to achieve a better and more sustainable future for all.
/-/https/www.sciencebuddies.org/cdn/Files/19752/5/E-WEB-Goal-09.png)
Variations
- This project classifies happy and sad face drawings. Can you think of other things you could use to teach Teachable Machine to classify (poses, sounds, shapes, etc.)?
- Have other people draw happy and sad faces. Can your model correctly identify happy and sad faces drawn by other people when you only trained the model on faces you drew yourself? What if you add their faces to the training data?
- What happens if you draw faces using colored pencils or markers? Will a model trained only on black and white images correctly identify them? What if you include them in the training data?
- What happens if you change the lighting, background or angle of the photos in your test data? Can the model still correctly identify happy and sad faces? What happens if you include a wider variety of photos in your training data?
- For each of your tests, look more closely at which images were misclassified. Do you notice any similarities? Can you use your observations to figure out how to design better training data?
Frequently Asked Questions (FAQ)
Careers
If you like this project, you might enjoy exploring these related careers:
/-/https/careerdiscovery.sciencebuddies.org/cdn/Files/1163/18/pexels-photo-1181472.jpg)
/-/https/careerdiscovery.sciencebuddies.org/cdn/Files/1011/20/pexels-photo-7375.jpg)

/-/https/img.youtube.com/vi/ONoWZ1rzYJA/0.jpg)
/-/https/img.youtube.com/vi/8ptiSuskdtU/0.jpg)
/-/https/img.youtube.com/vi/amyaYsJLjss/0.jpg)