Leaky Clues to Dam Design: How Reservoir Height Affects Hydroelectric Power Production
Abstract
It's hard to believe that the same water that you use every day to quench your thirst, cook with, bathe in, swim in, and wash your clothes and dishes, is capable of another trick—it can make electricity! Electricity can be generated through the flow or through the fall of water. A big, fast-flowing river, for instance, contains a lot of moving energy that provides enough pressure to turn the blades of a turbine and run an electric generator. This same pressure can also be created though through the fall of water from a great height. Dams are the way we store water and raise it to a great height to create pressure. The more water that is stored, the higher the height of the reservoir becomes, and the greater the pressure that is available to run an electric generator. In this energy and power science fair project, you'll make a small model of a dam and poke holes at different points along the dam wall to investigate the places where the pressure and the potential for generating electricity is the greatest.Summary
Kristin Strong, Science Buddies
This science fair project was inspired by the science activity outlined in the following source:
- Newton's Apple. (2006). Locks and Dams. Retrieved February 13, 2009, from http://www.newtonsapple.tv/TeacherGuide.php?id=1041
/-/https/www.sciencebuddies.org/cdn/Files/3779/5/Energy_img044.jpg)
Objective
To determine the best location on a dam to generate electricity by investigating how the height of water above a hole in the dam wall affects the length of the stream flow from that hole.
Introduction
Electricity is a big part of your life. Can you imagine not being able to turn on a light, the TV, the computer, or your video game console? What about having no way to easily wash and dry your clothes, or keep your food cold? When the power goes out in a big storm, it's a big deal! It is always a high priority for power workers to get it turned back on.
From where does all that electricity come? Electricity is a secondary energy source, meaning that it has to be made from some other source of energy, like coal, natural gas, oil, nuclear power, wind, or water. When electricity is made from the force or energy of moving water—water that is flowing or falling—it is called hydroelectricity (hydro means "water").
Hydroelectricity has been around since the late 1800's. Today, hydropower is a popular way to generate electricity, supplying the world with nearly one-fourth of what it needs, and reaching more than 1 billion people. Hydroelectric power has several advantages. Unlike fossil fuels, water is a source of renewable energy, meaning that it can be naturally replenished at a rate faster or similar to the rate that people use it up. Hydroelectric power is also low-polluting, dams to harness it can create recreational lakes, and the power can help with flood control and irrigation. Its disadvantages are that it can damage animal habitats or ecosystems, and in a failure, can cause flooding, such as the Teton Dam and Johnstown flood catastrophes, which you can read about in the Bibliography. Engineers weigh all these advantages and disadvantages before deciding whether or not to build a hydroelectric power plant.
Hydroelectricity is made through the flow or fall of water. A big, fast-flowing river, for instance, contains a lot of moving energy that provides enough water pressure to turn the blades of a turbine and run an electric generator. This same water pressure can also be created though through the fall of water from a great height. A dam is the way we store water and raise it to a great height to create water pressure. Dams are among some of the biggest manmade structures ever built.
/-/https/www.sciencebuddies.org/cdn/Files/3777/5/Energy_img010.jpg)
Figure 1. This photo shows the Hungry Horse Dam in the state of Montana. (Bonneville Power Administration, United States Department of Energy, 2003.)
Dams block the flow of a river or stream and create a lake or reservoir behind them, which acts as a source of stored energy (a battery is another example of a reservoir of stored energy). The dam raises the surface water up to a great height, giving it potential energy, the potential to do work. Water flows from the reservoir and through a dam by way of a special intake gate called a penstock. It's kind of like one of those water tunnels you slide through at a water park in the summer. Water rushes down the penstock and turns the blades of a turbine, which is connected through a metal shaft to an electric generator. As the turbine turns, giant magnets inside the generator rotate past copper coils and alternating current is made. This current is then transformed in a transformer to a higher-voltage current so the electricity can be sent over long distances to homes in cities far away from the power plant.
/-/https/www.sciencebuddies.org/cdn/Files/3778/5/Energy_img045.gif)
Figure 2. This animation shows how a hydroelectric power plant makes electricity. (United States Geological Survey, 2008.)
What determines how much electricity a hydroelectric power plant can produce? There are several factors, but two of the most important are the water flow rate through the dam, and the distance from the surface of the reservoir to the penstock. These determine how much energy can be released when the water is lowered, in a controlled way, from the reservoir. You can approximate the hydroelectric power production of a dam with this equation:
Equation 1:
- Power is in watts (W).
- Water flow rate is in kilograms per second (kg/s).
- Acceleration due to gravity is 9.81 meters per second squared (m/s2).
- Height is in meters (m).
- Coefficient of efficiency ranges from 0 to 1, with modern power plants having the highest efficiency.
In this power and energy science fair project, you will investigate how the distance between the surface of the reservoir and the penstock affects the flow out of the penstock. Do you think a deeper reservoir will create a different flow than a shallow reservoir? It's time to find out!
Terms and Concepts
- Hydroelectricity
- Hydropower
- Generate
- Fossil fuel
- Renewable energy
- Habitat
- Ecosystem
- Water pressure
- Dam
- Reservoir
- Potential energy
- Penstock
- Turbine
- Electric generator
- Magnet
- Alternating current
- Transformer
- Voltage
- Bernoulli equation
Questions
- What are the advantages and disadvantages of hydroelectric power?
- What are the parts of hydroelectric power plant?
- How does a hydroelectric power plant make electricity?
- What factors are important in determining how much electricity a hydroelectric power plant can produce?
- What are the different types of dams?
Bibliography
These sources describe the parts of a hydroelectric power plant and how it makes electricity:
- Bonsor, K. (2009). How Hydropower Plants Work. Retrieved February 13, 2009.
- Energy Information Administration. (2008, October). Energy Kid's Page: Hydropower—Energy from Moving Water. Retrieved February 17, 2009.
- Perlman, H. (2008, November 7). Hydroelectric power: How it works. Retrieved February 17, 2009.
These articles describe two historic dam failures:
- Wikipedia Contributors. (2015, September 19). Teton Dam. Wikipedia: The Free Encyclopedia. Retrieved January 28, 2016.
- Wikipedia Contributors. (2016, January 22). Johnstown Flood. Wikipedia: The Free Encyclopedia. Retrieved January 28, 2016.
This source discusses the Bernoulli equation, which describes the way liquids move and provides an equation for calculating the velocity of the stream flow from the height of the reservoir:
- The Millennium Mathematics Project Contributors. (2009). Testing Bernoulli: A Simple Experiment. Retrieved February 17, 2009.
Visit these pages, from PG&E, a California power, gas, and electric company, for more information about electricity:
- Pacific Gas and Electric Company. (2002). Electricity Generation and Distribution. Retrieved November 6, 2020.
- Pacific Gas and Electric Company. (2002). Alternative Energy Sources. Retrieved March 4, 2009.
For help creating graphs, try this website:
- National Center for Education Statistics (n.d.). Create a Graph. Retrieved February 17, 2009.
Materials and Equipment
Note: This science fair project requires access to a bathtub, garage, or outdoor area where you can experiment with slow-flowing water and not damage anything with water.
- Plastic milk jug, 1-gallon
- Permanent marker
- Ruler, metric
- Small nail, 1 inch long
- Duct tape
- Tape measure
- Stepping stool, or bricks or blocks of wood
- Timer
- Lab notebook
- Graph paper
Experimental Procedure
Note: Your milk jug will serve as a model of a reservoir, with one side of the milk jug acting as a model of a dam wall.
Preparing Your Milk Jug
- Rinse the milk jug out so that it's clean.
- Throw away the jug cap.
-
With the ruler and the permanent marker, make three marks on the wall of the milk jug that is opposite the handle:
- Make the first mark in the center of the wall, 3.5 inches up from the bottom.
- Make the second mark 1 inch to the left of the center mark and 1 inch up from the bottom.
- Make the third mark 1 inch to the right of the center mark and 6 inches up from the bottom.
-
Press the nail into each mark until it pokes through the wall of the milk jug. Once the nail pokes through, rotate it in a circle a few times, to help make a well-defined, circular hole. Be careful with the sharp nail.
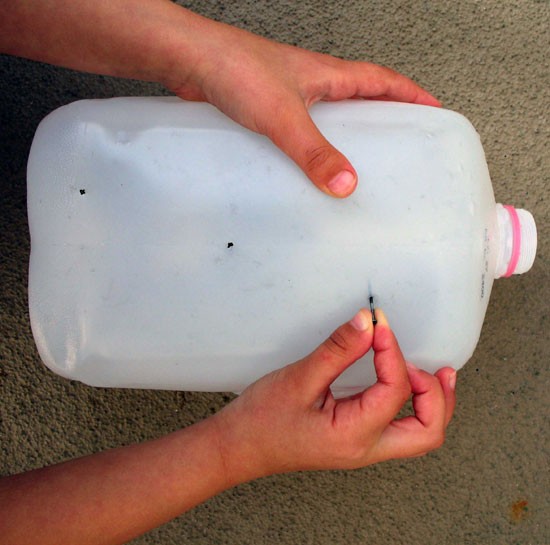
Figure 3. This photo shows how to punch holes in the milk jug and how to rotate the nail around the hole to create a well-defined, circular hole.
-
Cover the three diagonal holes with a strip of duct tape, as shown in Figure 4, pressing on the tape gently to seal the holes.
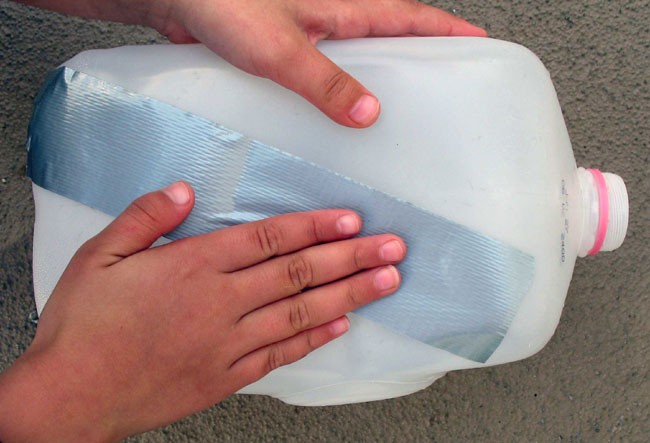
Figure 4. This photo shows how to cover the holes with duct tape.
- Take your milk jugs to the area where you plan to do the testing, such as a bathtub, a garage, or an outdoor area where it is safe to experiment with slow-flowing water. Ask your parents where to test if you are unsure about where a good area might be.
/-/https/www.sciencebuddies.org/cdn/Files/3779/5/Energy_img044.jpg)
/-/https/www.sciencebuddies.org/cdn/Files/3780/5/Energy_img046.jpg)
Testing Your Milk Jug
- Write down in your lab notebook what you think will happen when you fill the milk jug up with water and remove the piece of duct tape. Do you think any of the streams from the holes will be longer than the others? What do you think will happen to the length of the streams over time?
-
Make three data tables in your lab notebook, like the one shown below.
Stream Lengths Data Table 1
Time (min) Lowest Hole
Stream Length
(cm)Middle Hole
Stream Length
(cm)Highest Hole
Stream Length
(cm)Reservoir Height
(cm)0 1 2 3 - Place your milk jug in the test area on top of the stepping stool, stacked bricks, or blocks.
-
Extend a tape measure from the base of the milk jug out about 18 inches and lock it so that it stays in place in front of the milk jug, as shown in Figure 5.
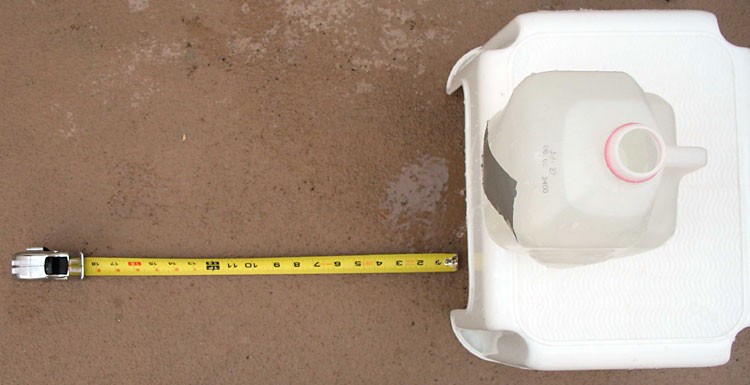
Figure 5. This photo shows how to set up of the milk jug, stepping stool, and measuring tape.
- Fill the milk jug up to the top with tap water.
- Get your timer ready and reset it to zero.
- Remove the duct tape from the milk jug and immediately start the timer. This will be your starting time (time = 0 min).
- Measure and write down the length of each water stream in your data table. Then immediately, with the ruler, measure and record the height of the reservoir (from the bottom of the milk jug to the surface of the water), and record your measurement in the data table.
- Repeat step 8 each minute, until the level of water in the milk jug reaches the level of the lowest hole.
- Repeat steps 5–9 two more times for your two other data tables.
/-/https/www.sciencebuddies.org/cdn/Files/3781/5/Energy_img047.jpg)
Analyzing Your Data Table
- Make three line graphs (one for each data table) that show time (in minutes) on the x-axis and stream length (in cm) on the y-axis for all the holes. You can make the line graph by hand or use a website like Create a Graph to make the graph on the computer and print it.
- Go to your data table and calculate the difference between the reservoir height and the hole height for each hole when the stream length went to zero. Is this difference the same for all the holes?
- Looking at your line graphs, do the shapes of the line graphs look the same for all three trials? Which hole produced the longest stream length? Did this hole produce the longest stream length over the entire test time? Which hole produced the shortest stream length? Did this hole produce the shortest stream length over the entire test time? Based on your results do you think the water pressure on a dam wall is greatest at the bottom of a dam, the middle, or near the top of a dam? If you were building a dam, where would you make the dam the strongest? Where would you place the penstock? At which hole depth do you think the most electricity can be produced? Based on the results of your experiment, can you predict what would happen if you made a horizontal row of holes, all at the same height, in the dam wall? Would the stream lengths all be the same? Give it a try and see!
Ask an Expert
Global Goals
The United Nations Sustainable Development Goals (UNSDGs) are a blueprint to achieve a better and more sustainable future for all.
/-/https/www.sciencebuddies.org/cdn/Files/19750/5/E-WEB-Goal-07.png)
Variations
- Investigate how hole size affects stream flow for a given hole height.
- Develop a way to calculate the peak water flow rate out of each hole. (The bibliography will give you hints on how to do this with the Bernoulli equation.) Assume an efficiency of 0.9 (common for today's modern power plants), and calculate the power that can be produced with each stream, using Equation 1 in the Introduction.
Careers
If you like this project, you might enjoy exploring these related careers:
/-/https/careerdiscovery.sciencebuddies.org/cdn/Files/1133/17/pexels-photo-3862135.jpg)
/-/https/careerdiscovery.sciencebuddies.org/cdn/Files/1372/24/iStock-1158650282.jpg)
/-/https/careerdiscovery.sciencebuddies.org/cdn/Files/1686/17/unsplash-oh40PfFL520.jpg)
/-/https/careerdiscovery.sciencebuddies.org/cdn/Files/1125/17/pexels-photo-3862390.jpg)

/-/https/img.youtube.com/vi/vlDaK6GsEEQ/0.jpg)
/-/https/img.youtube.com/vi/YDrcVgKGp_0/0.jpg)
/-/https/img.youtube.com/vi/flk0PX3WJe0/0.jpg)