Abstract
Have you ever watched how trees sway and bend in a strong wind? Have you ever thought about all the homes that could be powered with forces from the wind? In this project you'll discover, through trees, good places in your community for generating wind power.Summary
Kristin Strong, Science Buddies
/-/https/www.sciencebuddies.org/cdn/Files/12149/4/wind-bending-tree-thumbnail.jpg)
Objective
In this project you will use trees to identify good and bad locations for harvesting wind energy.
Introduction
/-/https/www.sciencebuddies.org/cdn/Files/12149/4/wind-bending-tree-thumbnail.jpg)
Wind is a free resource. It can be used to make electrical power. A wind generator is a machine that takes the forces in wind and changes them into power. A wind generator does a better job of making power if it is in a good location, which means one that has an average wind speed of 10-13 miles per hour, or better, for over a year. A good location is also free from "bad winds" that can damage the wind generator, such as turbulent or chaotic winds that change quickly in force, speed, and direction.
Why is the location for a wind generator so important? Let's look at a graph showing how the power that a wind generator can produce changes with wind speed:
/-/https/www.sciencebuddies.org/cdn/Files/3193/5/EnvEng_img025.gif)
Example graph shows the power output of a wind generator based on wind speed. The graph curves upward which indicates that small increases in wind speed will greatly increase power output.
Figure 1. How wind generator power changes with wind speed.
The graph shows that the power the generator is able to produce increases by the cube of the wind speed (see Equation 1, below). To cube a number means to multiply the number by itself twice. For example, two cubed (written mathematically as 23) is 23 = 2×2×2 = 8. Therefore, a small increase in wind speed results in a large increase in the power that the wind generator can produce.
Equation 1:
It is the job of environmental engineers to figure out where to locate wind generators. They study the land for clues that a location has a good source of strong, non-turbulent wind. One of the most important clues they use is trees. Trees change their shape in response to winds as they grow:
- A tree growing on land with little or no winds will grow up straight and symmetric. It will look the same from all sides.
-
A tree growing on land with mild, steady winds will begin to have its branches swept to one side away from the wind. It will no longer look the same all around. The side away from the wind will be more full.
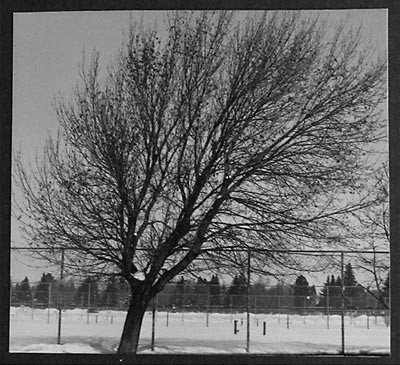
Figure 2. Example of a tree growing under the influence of mild, steady winds.
- A tree growing on land with strong, steady winds will have most of its branches swept to one side away from the wind. It will begin to look like a flag.
/-/https/www.sciencebuddies.org/cdn/Files/3196/5/EnvEng_img028.gif)
/-/https/www.sciencebuddies.org/cdn/Files/3192/5/EnvEng_img024.jpg)
Environmental engineers can use the amount of "tree flagging" to estimate the average wind speed in a location over a year. The Griggs-Putnam Index is the visual chart that allows them to make those estimations.
Environmental engineers are also on the lookout for evidence of bad, turbulent winds like "tree throwing," which results in a leaning tree trunk, as shown below in Figure 3. Broken branches around the tree are also indicators of wind turbulence.
/-/https/www.sciencebuddies.org/cdn/Files/3195/5/EnvEng_img027.gif)
/-/https/www.sciencebuddies.org/cdn/Files/3194/5/EnvEng_img026.jpg)
Figure 3. Example of tree throwing.
Terms and Concepts
To do this project, you should know what the following terms mean. Have an adult help you search the Internet, or take you to your local library to find out more.
- Wind
- Wind generator
- Wind speed
- Cube
- Tree flagging
- Griggs-Putnam Index
- Tree throwing
- Wind turbulence
- Terrain
- Windward
- Leeward
- Mean
Questions
- How does terrain influence the mean annual wind speed?
- How does terrain influence wind turbulence?
- How do structures influence the mean annual wind speed and wind turbulence?
Bibliography
- This source discusses how to find the best location for placing small wind generators, as well as how structures and terrain influence winds:
Southwest Windpower. (2007). Siting Wind Generators. Retrieved February 22, 2008. - This website shows the Griggs-Putnam Index:
Southwest Windpower. (n.d.). Griggs-Putnam Energy Index. Retrieved February 22, 2008. - This book provides a complete discussion of the methods used to locate wind generators. It also includes the Barsch Index, which is the visual chart that classifies wind-caused tree deformation for broad-leaf trees.
Hiester, T.R. and Pennell, W.T., Siting Handbook for Large Wind Energy Systems, Windbooks, Inc., 1981.
Materials and Equipment
To do this project, you will need the following materials and equipment:
- Access to windy locations
- Lab notebook
- Pen or pencil
- Griggs-Putnam Index of Deformity Rating chart
- Digital camera or paper to sketch drawings (optional)
- Graph paper
Experimental Procedure
- Find several windy locations that have different types of terrain. Examples are:
- Windward side of a hill
- Crest of a hill
- Leeward side of a hill
- Windward side of a building or natural structure
- Leeward side of a building or natural structure
- Flat ground
- Pick out three trees at each of the locations.
- Make two data charts to record your observations: one for recording each tree's wind speed index and one for recording evidence of turbulence. See the examples below.
Swipe left to see moreWind Speed Index Data Chart Windward Side of Hill Crest of Hill Leeward Side of Hill Tree 1 Tree 2 Tree 3 Sum Average
Evidence of Turbulence Data Chart (Yes=1; No=0) Windward Side of Hill Crest of Hill Leeward Side of Hill Tree 1 Tree 2 Tree 3 Sum Average
- For each tree, record:
- The tree's Griggs-Putnam Index of Deformity Rating (Number from 0 to VII)
- Any evidence of turbulent winds? (Yes=1; No=0)
- If desired, photograph the trees and any evidence of turbulence for your poster, or draw a sketch of the trees in your lab notebook.
- Plot your data on two graphs, in bar chart format. On the first graph, the y-axis should be the average Griggs-Putnam Index of Deformity Rating and the x-axis should be terrain or location. Be sure to include a key showing the wind speed range for each index. On the second graph, plot the average evidence of turbulence vs. terrain.
Ask an Expert
Global Goals
The United Nations Sustainable Development Goals (UNSDGs) are a blueprint to achieve a better and more sustainable future for all.
/-/https/www.sciencebuddies.org/cdn/Files/19750/5/E-WEB-Goal-07.png)
Variations
- For land without trees, you can get estimates of wind speed using the Beaufort Wind Speed Scale (retrieved March 10, 2008 from http://en.wikipedia.org/w/index.php?title=Beaufort_scale&oldid=197072678). Record your estimates at the same time each day over several days, and figure out the average.
- If you notice signs of turbulence on the leeward side of a building or structure, measure the distance from the structure to the point at which the signs of turbulence stop. If possible, measure the height of the structure. What is the ratio of these two numbers? Do you get a similar ratio when you evaluate other structures?
Careers
If you like this project, you might enjoy exploring these related careers:
/-/https/careerdiscovery.sciencebuddies.org/cdn/Files/1888/17/unsplash-IU10leGdwxg.jpg)
/-/https/careerdiscovery.sciencebuddies.org/cdn/Files/20218/6/EnvEng_KeyPhoto.jpg)
/-/https/careerdiscovery.sciencebuddies.org/cdn/Files/1576/17/iStock-459013781.jpg)
/-/https/careerdiscovery.sciencebuddies.org/cdn/Files/1894/17/iStock-870031246.jpg)

/-/https/img.youtube.com/vi/TFGeefF82o8/0.jpg)
/-/https/img.youtube.com/vi/s7bopU_N_fQ/0.jpg)
/-/https/img.youtube.com/vi/OfG4Ex83BiM/0.jpg)