Abstract
Digital cameras can be a great way to learn about photography. Most digital cameras today have LCD screens, so you get instant feedback on your photo. If you make a mistake, no problem, you just delete the picture. It's nice that you don't have to worry about the expense and bother of developing film! This project can help you learn to take better pictures.Summary
/-/https/www.sciencebuddies.org/cdn/Files/12118/4/photos-dynamic-range-thumbnail.png)
Objective
The goal of this project is to learn how to match the range of light intensities in your subject to the dynamic range of your digital camera. You'll learn how to use gray level histograms to do this.Introduction
/-/https/www.sciencebuddies.org/cdn/Files/12118/4/photos-dynamic-range-thumbnail.png)
Many digital cameras are the 'point and shoot' type that do all of the exposure settings automatically. If you want to get serious about taking good pictures, it is worthwhile to spend some time learning how to use a camera in manual mode, where you set the lens aperture and shutter speed yourself. A camera with manual mode capability is essential for this project.
You should read your camera's instruction manual so that you are familiar with the steps used for putting the camera into manual mode, and for adjusting the camera's lens aperture (f-stop) and shutter speed. You should also do background research so that you understand how changing the f-stop affects the camera's depth of focus, and how changing the shutter speed affects your ability to 'freeze' moving objects.
One of the toughest challenges for taking good pictures is the huge range of light levels in the natural world. Let's consider the extremes. From the dimmest (starlight) to the brightest (full sunlight) illumination, the ratio is 1:1,000,000,000. In other words, the full sunlight is 1 billion times brighter than starlight. Obviously, most photographic subjects do not span this entire range of intensities, but even on a cloudy day, it is easy to find subjects with a range of light levels of 1:5000 or 1:10,000, and even wider ranges on a day with full sun. The challenge is to represent these differences in light level from your subject to differences in light levels in your photograph.
The range from the dimmest spot to the brightest spot in your subject is called the dynamic range of your subject. Your camera has its own dynamic range, which is quite often smaller than the dynamic range of your subject (one of the reasons that photography can be challenging!) In this project you'll learn how to measure the dynamic range of your digital camera. You'll also learn how to use pixel gray level histograms (or RGB histograms, for color photography) to match the dynamic range of your photographic subjects to the dynamic range of your camera.
A digital camera essentially converts light levels to numbers. Typically, the camera delivers its output in the form of a JPEG file, which can have gray levels ranging from 0–255. Many cameras have a display mode that shows you a gray level (or RGB level, for color photos) histogram of the photo (Figure 1). The x-axis shows the available gray levels, from 0–255. The y-axis shows the number of pixels at each gray level in the image.
/-/https/www.sciencebuddies.org/cdn/Files/2839/3/Photo_img044.jpg)
Figure 1. Example of a pixel gray level histogram (left) from a digital image (right). The x-axis shows the available gray levels (0–255). The y-axis shows the number of pixels at each gray level in the image. Exposure was 1/125 second at f/2.8.
Compare the two tiles on the right-hand side of the image to the two tiles in the center of the image. The tiles on the right have sunlight falling on them from a nearby window. Notice that there is almost no texture visible in the two tiles on the right, compared to the two tiles in the middle. In the histogram, the pixels from the tiles on the right are stacked up at the rightmost edge, i.e. gray level 255. We say that those pixels are saturated, because they can't get any brighter. The camera's sensor can no longer register a change in brightness there, so we can't see any texture there in the photograph.
Figure 2 shows an image of the same scene, using a shorter exposure time. Compare the histogram and the image to Figure 1. The sunlit tiles on the right now have clearly visible texture, and the histogram is no longer saturated at the high end. On the other hand, there is less detail visible now in the shadowed areas behind the coffee cup and the roll of paper towels. You can also see from the histogram that there is an 'unused' range of pixel values at the high end. An ideal exposure time might have been in between 1/125 and 1/250 second (e.g., 1/160 second, if available on the camera; alternatively, the aperture could have been closed down by 1/3 or 1/2 stop).
/-/https/www.sciencebuddies.org/cdn/Files/2840/5/Photo_img045.jpg)
Figure 2. Same scene as in Figure 1, but with half the exposure time (1/250–second, f/2.8). Now the bright end of the histogram is no longer saturated, and the texture of the sunlit tile is visible.
These two examples illustrate the kinds of trade-offs you need to make in order to make best use of your camera's dynamic range. When you are setting up your camera to take a photograph, you need to match the dynamic range of the subject to the dynamic range of your camera. Sometimes you may lose detail in one region of the image (the shadows, for example) in order to make sure that you are showing sufficient detail in the highlights. For example, you may be interested in showing details of clouds in the sky, and be willing to sacrifice detail in the shadowed areas. On the other hand, your goal might be to show texture in the dark bark of a tree, and you might be willing to lose detail in the sky to do this. Finally, you might think of ways to increase the light falling on dark areas (e.g., having an assistant hold up a reflector, outside of the camera's field of view) in order to decrease the dynamic range of the subject and maintain sufficient detail at both ends of the gray level histogram. With practice, you'll find that understanding your camera's dynamic range and using gray level histograms improves the quality of your photographs.
Terms and Concepts
To do this project, you should do research that enables you to understand the following terms and concepts:
- Pixel gray levels
- Saturation
- Dynamic range
- Exposure control:
- Aperture (f-stop)
- Shutter speed
More advanced students may also want to do research on the CCD sensors used in digital cameras.
Questions
- If the histogram for an image shows saturation at the high end (lots of pixels piled up at gray level 255), what adjustment of the shutter speed would help to reduce the saturation?
- What adjustment of the lens aperture would help in this situation?
- If you close down the lens aperture by one f-stop (e.g., from f/5.6 to f/8), what change do you need to make to the shutter speed to keep the exposure constant?
- If you want to increase your depth of focus for a photograph, what change should you make to the lens aperture?
Bibliography
- This is an excellent guide to interpreting image histograms for determining the optimum exposure time for digital photographs:
Hoffman, S., 2004. A Practical Guide to Interpreting RGB Histograms, Steve Hoffman's Nature and Landscape Photography. Retrieved February 19, 2007. - These pages are good resources for learning about exposure control, including lens apertures and shutter speeds:
- All Things Photography, 2006a. The Lens Aperture, All Things Photography. Retrieved February 19, 2007.
- All Things Photography, 2006b. The Shutter Speed, All Things Photography. Retrieved February 19, 2007.
- ImageJ is a public domain Java image processing program that runs on any computer with a Java 1.4 or later virtual machine. Downloadable distributions are available for Windows, Mac OS, Mac OS X and Linux. The webpages below are the ImageJ home page, the ImageJ download page, and the ImageJ installation instructions page:
- Rasband, W.S., 1997–2006a. ImageJ Home Page, U. S. National Institutes of Health, Bethesda, MD. Retrieved February 19, 2007.
- Rasband, W.S., 1997–2006b. ImageJ Download Page, U. S. National Institutes of Health, Bethesda, MD. Retrieved February 19, 2007.
- Rasband, W.S., 1997–2006c. ImageJ Installation Instructions Page, U. S. National Institutes of Health, Bethesda, MD. Retrieved February 19, 2007.
Materials and Equipment
To do this experiment you will need the following materials and equipment:- Digital camera that can take reasonably long (10–20 s) exposures under full manual control
- Computer
- Imaging software that can create histograms of pixel values from digital photos:
- This project uses a freely available, multi-platform program called ImageJ.
- If you have Adobe Photoshop it will also work, but you will need to figure out how to create the histograms on your own (should be pretty easy).
- Sheet of white paper
- Tripod (useful, but not absolutely necessary)
- Locations for taking photographs
Experimental Procedure
Measuring Your Camera's Dynamic Range
- Use the following procedure to measure your camera's dynamic range (its range of response to different light levels).
- Set up a piece of white paper so that it is uniformly illuminated by indirect sunlight.
- Set up the camera so that the paper fills the field of view. Mount the camera on a tripod, if you have one. Otherwise, place the camera on a solid support. (Many of the exposures you will take will be too long for hand-holding the camera.)
- Put the camera in manual mode. If the camera has a manual focus mode, use it to set the correct focal distance. (The autofocus system may have difficulty focusing on the blank white paper, and you want the camera set at a constant focal distance.)
- Keep the ISO and aperture settings constant.
- Take a series of photos at different shutter speeds, varying by a factor of 2 each time. For example: 8, 4, 2, 1, 1/2, 1/4, 1/8, 1/15, 1/30, 1/60, 1/125, 1/250, 1/500, 1/1000 s.
- To avoid shaking the camera when you take the photo, use the camera's self-timer feature, if available.
- Repeat the sequence twice. This is a control to make sure that the ambient light level is constant. You should get very similar results each time. If not, repeat the test. Avoid changing light conditions, such as when the sun is periodically dimmed by clouds.
- Follow your camera's instructions to download the photos to your computer.
- Use an image processing program to measure the average pixel intensity of each photo. We used ImageJ, a freely available, multi-platform scientific image analysis program (Rasband, 1997–2006a). Here's how:
- Follow the instructions on the ImageJ website to download and install the program (Rasband, 1997–2006b; Rasband, 1997–2006c).
- Start the ImageJ program. You'll see a small window similar to the one in the screenshot (the 'skin' may look slightly different on your system). This window is the ImageJ menu bar.
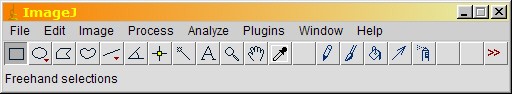
Screenshot of the opening window for the program ImageJ. ImageJ opens up to a small window that consists only of a row of icons and application menus.
- Use the "File/Open..." menu command to open your first image file.
- Use the "Analyze/Histogram" menu command (or type "H") to create a histogram of pixel values for the image.
- The histogram will pop up in its own window, similar to the screenshot:
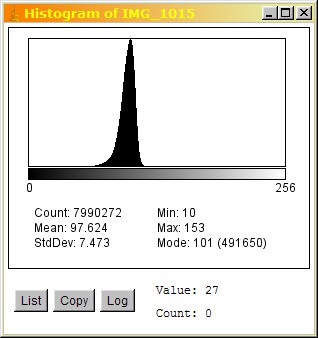
The example histogram generated in the program ImageJ shows almost no variation in pixel values. All the pixel values in an image scanned fall within a specific range near the center of the graph. The graph has a minimum gray value of 10, a maximum of 153 and an average value of 97.6.
- Make a table in your lab notebook to keep track of the pixel intensity information for each file. For example:
Filename Shutter Speed
(from your camera's photo-browsing software)Pixel Gray Level Statistics Mean Std. Dev. Min Max Mode
- Use "File/Open Next" (keyboard shortcut "Shift+O") to open the next image file.
- Repeat steps 3d–3g until you have analyzed all of your calibration files.
- Make a graph of average pixel gray level vs. shutter speed.
- Which 'average' value should you choose for plotting on the y-axis? The short answer is: either the mean or the mode should work fine. (See the Science Buddies reference on Mean, Median, and Mode for more information.)
- Since you are using a logarithmic series of shutter speeds, your x-axis should be logarithmic.
- Use semi-log graph paper, or set up your graphing program to use a logarithmic axis for the x-values.
- Here is an example graph, plotting the mode of the gray levels vs. shutter speed for a series of photos (two trials for each shutter speed):
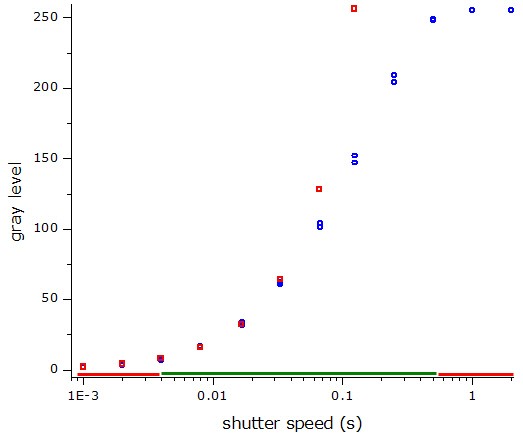
This graph shows that as the camera shutter speed slows, the gray value of pixels in an image will decrease. This means that pixels in an image will be brighter the longer the camera shutter is open while taking a picture.
- The red bars show the regions of saturation, the green bar at the center shows the available dynamic range of the camera.
- From your graph, determine the dynamic range of your camera.
/-/https/www.sciencebuddies.org/cdn/Files/2841/3/Photo_img041.jpg)
/-/https/www.sciencebuddies.org/cdn/Files/2842/3/Photo_img042.jpg)
/-/https/www.sciencebuddies.org/cdn/Files/2843/3/Photo_img043.jpg)
Using Pixel Intensity Histograms to Match Subject Light Levels to Camera Dynamic Range
You can also use gray level histograms to see how well your chosen exposure settings (f-stop and shutter speed) map the dynamic range of the image to the dynamic range of your camera.- Your camera may have a display mode which displays a histogram of a stored image. Some cameras even show a histogram for the current exposure settings, even before you've snapped the image. Check your camera's instructions to see how to display gray level histograms.
- Experiment with different exposure settings to see how the gray level histograms change.
- Use the procedure for making histograms with ImageJ to illustrate your results.
Ask an Expert
Variations
- Look for subjects that have different levels of contrast. For example, subjects with sun and shade are high contrast. Subjects in indirect sun tend to be lower contrast. Is it harder to get good photographs with high-contrast or low-contrast subjects? Can you use the full dynamic range of your camera in both cases?
- See if you can take a photograph of an egg on black velvet cloth. Can you adjust the lighting and exposure settings to match the wide dynamic range of this image to your camera? Can you take a photograph that shows texture and detail in both the surface of the egg and the cloth? This may be harder than you think!
Careers
If you like this project, you might enjoy exploring these related careers:
/-/https/careerdiscovery.sciencebuddies.org/cdn/Files/1442/17/unsplash-TXxiFuQLBKQ.jpg)
/-/https/careerdiscovery.sciencebuddies.org/cdn/Files/1640/26/Fyysikot_tyossaan.jpg)

/-/https/img.youtube.com/vi/0KjnJYoIqPA/0.jpg)
/-/https/img.youtube.com/vi/rzEYT7V-yUk/0.jpg)
/-/https/img.youtube.com/vi/yUsjx5MVhaQ/0.jpg)