Abstract
If you were leaving home for a long walk, how far would you go? One mile, 5 miles, 10 miles? How about 550 miles?! That's a long way, but some wolves have been known to travel that far when they are leaving their packs in search of a mate so they can form their own pack. But is that how far wolves normally travel? Try this wild wolf tracking science fair project to find out!
Summary
None
This science fair project requires installing Google Earth Pro and downloading wolf tracking data from the Movebank database.
No issues
Dr. Wikelski, PhD
/-/https/www.sciencebuddies.org/cdn/Files/3713/10/Zoo_img042.jpg)
Objective
Determine the total size of a gray wolf pack's territory and whether the pack's movements change depending on the season.
Introduction
Have you ever put a collar on a dog? Depending on the dog, it can be tricky to get the animal to stay still while you buckle the collar in place. Now imagine putting a collar on a wild wolf! As challenging and difficult as that task sounds, for some people, it's a routine part of their jobs.
Every summer, the wildlife biologists who work for the Biological Resources Division of the U.S. Geological Survey use safe, humane traps to catch wild wolves. Once caught, the wolves are anesthetized. Anesthetic drugs have varying effects, such as loss of sensation or loss of consciousness (sleep). When catching wolves, the biologists give them a type of anesthetic that causes them to fall asleep for a certain period of time. While the wolves sleep, they are fitted with radio collars. Each collar has a transmitter, which sends out a unique frequency. This is similar to how different radio stations each broadcast on a different radio wave frequency. When you want to listen to a particular radio station, you tune in to the broadcast signal using a radio, which is actually a type of receiver. If you want to listen to a different radio station, you change the receiver's (in this case your radio) settings to tune in to another frequency. Similarly, the radio collar of each wolf broadcasts a unique frequency and the biologists use antennas and receivers to tune in to those frequencies and use the strength of the signal to pinpoint the wolf's location. This system of using radio transmitters and receivers to track the movements of wildlife is called radio telemetry.
Other transmitting tags that are frequently used in animal tracking are GPS tags. These tags have their own global positioning system (GPS) inside the tag. The GPS receives signals from multiple orbiting satellites to determine a location. Most smart phones are equipped with similar GPS technology, which the device can use for navigation purposes. One disadvantage of GPS tags is that they need to be in air to be able to communicate with satellites. Thus, such sensors cannot be used for animals that live in the
/-/https/www.sciencebuddies.org/cdn/Files/3713/8/Zoo_img042.jpg)
Figure 1. In this science fair project, you'll use real radio telemetry data to track the movements of packs of wild wolves, like the gray wolf shown here. (U.S. Fish & Wildlife Service, 2008.)
Using radio telemetry and GPS tagging to find and follow specific animals has helped wildlife biologists learn many things about the gray wolves,, including where the wolves travel, what they eat, how much they move around, when they rest, how many wolves live together, and how often they come in contact with humans. From years of observation, biologists know that gray wolves live in packs. These packs usually consist of a group of 5–9 wolves. Two of the wolves, a male and female pair who are unrelated, are the dominant wolves. They mate and birth a litter of pups every year. The other wolves in the pack help feed and raise the wolf pups, but do not have any pups of their own. Often, the non-breeding wolves in a pack are older offspring of the dominant pair. These wolves will stay around for a couple of years before dispersing (leaving the pack) to find their own mates and start their own packs.
Wolves are territorial. Each wolf pack has a specific territory (area of land) in which it hunts for food, raises its pups, and that it defends from other wolf packs. How large do you think a wolf territory is? And do they use the same area of land all year around? Do they travel more in some seasons than in other seasons? These are the types of questions that wildlife biologists try to answer, and you can discover the answers, too, by analyzing the tracking data from real wild wolves! This science fair project will show you how to access, map, and analyze GPS tracking data from grey wolves in the Northeastern Alberta's Athabasca Oil Sands Region. Get ready to find out when and where those wild wolves wander!
Terms and Concepts
- Anesthesia
- Radio collar
- Transmitter
- Frequency
- Receiver
- Antenna
- Radio telemetry
- GPS tag
- Global Positioning System (GPS)
- Gray wolf
- Wolf pack
- Dominant wolf (sometimes called an alpha wolf)
- Dispersal
- Territory
- Trend
Questions
- What is the structure of a wolf pack? Why do animals sometimes disperse (leave the pack)?
- What is the reproductive cycle of wolves? When do they breed and for how long do they gestate?
- What are the dietary needs of a wolf and how do they hunt their food?
- What is life like for a wolf pup as he or she "grows up"?
- How does radio telemetry and GPS tagging work?
- What are some applications of radio telemetry?
Bibliography
Information about gray wolves can be found by exploring these websites:
- Wikipedia Contributors. (2008, December 28). Gray Wolf. Wikipedia: The Free Encyclopedia. Retrieved December 29, 2008.
- National Geographic Kids (n.d.). Gray Wolf facts. Retrieved December 9, 2021.
These resources offer more information about radio telemetry and GPS tags:
- Wikipedia Contributors. (2008, December 20). Telemetry. Wikipedia: The Free Encyclopedia. Retrieved December 30, 2008.
- Wildlife Journal Junior (2021). Tracking Wildlife. Retrieved December 9, 2021.
For help creating graphs, try this website:
- National Center for Education Statistics, (n.d.). Create a Graph. Retrieved June 25, 2020.
Materials and Equipment
- Computer with Internet access
- Permission to download and install Google Earth Pro
- Lab notebook
- Graph paper
Disclaimer: Science Buddies participates in affiliate programs with Home Science Tools®, Amazon.com, Carolina Biological, and Jameco Electronics. Proceeds from the affiliate programs help support Science Buddies, a 501(c)(3) public charity, and keep our resources free for everyone. Our top priority is student learning. If you have any comments (positive or negative) related to purchases you've made for science projects from recommendations on our site, please let us know. Write to us at [email protected].
Experimental Procedure
In this science project, you will download real tracking data from grey wolves in Alberta, USA, using the Movebank.org database. Then you will look at individual wolf tracks and territories in Google Earth Pro and analyze the total size of a gray wolf pack's territory and whether the pack's movements change depending on the season.
Setting Up and Downloading the Wolf Tracking Data
- To do this science project, you will need to install Google Earth Pro on the computer you are using. Google Earth is a program that allows you to map locations and look at satellite images of places all around the world. Be sure you have permission to download this from the computer's owner before you begin.
- A free version of Google Earth Pro can be downloaded from Google Support.
- You might find it useful to try one of the tutorials or to consult the Google Earth User's Guide to familiarize yourself with Google Earth Pro. The Google Earth general help page is a useful starting point if you have questions about how to use different parts of the program.
- The next step is to download the wolf tracking data. Go to the Tracking Data Map page in Movebank to access the wolf tracking data. Enter the study name "ABoVE: Boutin Alberta Grey Wolf" into the search box and select the respective study. You can find more details on how this site works in the Movebank "Tracking Data Map" User Manual.
- If you want to find out more information about your chosen data set, you can browse the Studies page details for your selected study. You get to the Studies page by clicking on "Studies" in the upper left corner of the page.
- Follow the instructions in the Movebank tutorial "Accessing data in Movebank" to download your data. Specifically follow the instructions in the section "Downloading data in Movebank format." Keep all the default settings in the download window and choose "GoogleEarth (Tracks)" as the file type.
- Open the downloaded Google Earth file in Google Earth Pro. It will contain the path of each tracked animal on a map, complete with satellite images of each location. Examples of two wolf tracks are shown in Figure 2.
- You might find it useful to try one of the tutorials or consult the Google Earth Pro User's Guide to familiarize yourself with Google Earth Pro. The Google Earth general help page is a useful starting point if you have questions about how to use different parts of the program.
Identifying the Wolves' Seasonal Movement Patterns and Territory Size
- Once the Google Earth file has opened, you will see location points (dots) connected by movement tracks (lines). If you only see lines and no dots, double-click on the study name in your "Places" section in Google Earth Pro. Each animal in the study will have a single color. All the dots corresponding to the location of a specific animal will be in the same color. In Figure 2, tracks of two different wolves are shown. One wolf's data is color-coded light green and the other is color-coded red.
- Note: The location points mark coordinates reported by the wolf's tag. The tracks are generated by making the shortest possible line between the two location points that are closest together in time. The tracks are the "best guess" of the path the wolves took, but only the location points are precise data.

/-/https/www.sciencebuddies.org/cdn/Files/18040/9/two-wolf-tracks-dots-lines.png)
Figure 2. Partial view, in Google Earth Pro, of the movement tracks of two wolves. The dots show locations where they were tracked using GPS sensor tags. The lines connect temporally sequential locations in an approximation of the wolves path. (Data shown here was collected by Stan Boutin et al. and accessed through Movebank.)
- Not all of the 46 animal tracks in a study might be good for analysis. Some tracks might have ended prematurely if the tag fell off the animal, if the animal died, or if the tag stopped functioning for technical reasons. Choose a good track for your analysis.
- Look at each track individually. To do this in Google Earth Pro, go to the menu on the left-hand side of your screen. Under "Places" you will see the study data. It will show your study name as "ABoVE_Boutin Alberta Grey Wolf.kmz". To see the different wolves in the study, click the little arrow next to the study's name. Now you will see a separate ID number for each wolf. Click the box next to a wolf's ID to select (box is checked) or un-select (box is un-checked) each animal. See Figure 3 for details. Wolf tracks with selected (checked) IDs will be displayed on the map.
- Underneath each wolf's ID in Google Earth are the number of location events (n) recorded for that wolf and the time span over which the data was collected. For example, in Figure 3, 2775 locations were recorded from wolf's 32269-33678-32269 GPS tag from March 20, 2012 through July 14, 2012. The best tracks for analysis will:
- Span a year, or more, of time, thus giving you a view of where the wolf is throughout the entire year.
- Have a normal or high number of recorded location events compared to other wolves in the study.
- Write down in your lab notebook at least ten tracks you consider to be complete and good for analysis.
/-/https/www.sciencebuddies.org/cdn/Files/18041/8/selected-unselected-tracks.png)
A cropped screenshot of selected data files in the sidebar of Google Earth. In Google Earth there is a sidebar labeled 'Places' which contains a file tree where files can be toggled on and off using a checkbox. The folder named 32269-33678-32269 and 32262-33668-33668 are selected to be shown on the map.
Figure 3. In this case, wolves with the ID number 32269-33678-32269 and 32262-33668-33668 are selected (checked) and their tracks would be displayed on the map. Wolf 33669-33669 would not be displayed because its ID has not been selected.
- Once you have a list of ten good tracks for analysis, take a careful look at three of them, using Google Earth Pro. For each wolf track, review the provided data points to find out if their territory changes dependent on the season of the year.
- If you click on a location point, it will tell you more information about that point, including the timestamp. The timestamp is when the tag recorded the wolf at that location. Using the timestamps, determine:
- What the wolf's preferred territory for each season (spring, summer, fall, winter) is. Hint: For each data point, decide which season it falls in. Note, if there are too many data points, you don't have to look at every single one. Selecting two or three out of a cluster of points is probably enough.
- Approximately how long the wolf spent at each location and how often it traveled in between.
- Once you've reviewed the data points on the map and you have found preferred territories for each season, you can use the "polygon" tool in Google Earth Pro to draw the boundaries for each territory. Use a different colored polygon to mark the territory for each season. Some areas may have been visited by the wolves in more than one season. If a particular area on the map is part of the wolves' territory for more than one season, include that section in all of the polygons that represent the seasons when the wolves were located there.
- Give each polygon a specific name. Every new polygon will show up in your list under places, most likely under the wolf ID that you used to draw your polygon, as shown in Figure 4.
- To learn how to use the polygon tool, consult Google Earth Pro's help page on Drawing Paths and Polygons.
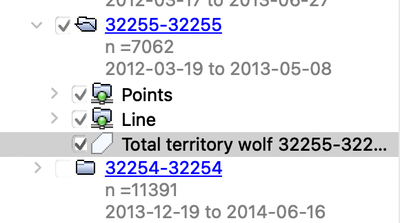
A cropped screenshot of selected data files in the sidebar of Google Earth. In Google Earth there is a sidebar labeled 'Places' which contains a file tree where files can be toggled on and off using a checkbox. The selected files include a polygon that has been added to the list after drawing it within Google Earth.
Figure 4. Once you have drawn and saved a polygon, it will show up in the list under "Places" in the left side bar.
- If you click on a location point, it will tell you more information about that point, including the timestamp. The timestamp is when the tag recorded the wolf at that location. Using the timestamps, determine:
- In the next step, look at the size of the wolves' territory and make a bar graph to represent the data.
- There should be a total of five bars in your bar graph, one each for fall, winter, spring, summer, and one representing the total territory independent of season.
- To find out the territory size, select a territory polygon in your Google Earth side bar under "Places". Right click on the polygon name and click on "Get Info." In the window that pops up, there is a "Measurements" tab. Once you click on the "Measurements" tab, you will find the calculated Perimeter and Area for your selected polygon.
- Write the area for each of the polygons down in your lab notebook. Do this for each seasonal territory and the total territory for each wolf. To get the total territory, draw a new polygon that surrounds all the data points of one wolf, as shown in Figure 5. Then look at the calculated area for this polygon.
- Use the data collected to create a bar graph that shows the seasonal and total territory size for each wolf.
- If you need help making graphs, or would like to use an online program to make them on the computer and print them, try Create a Graph.
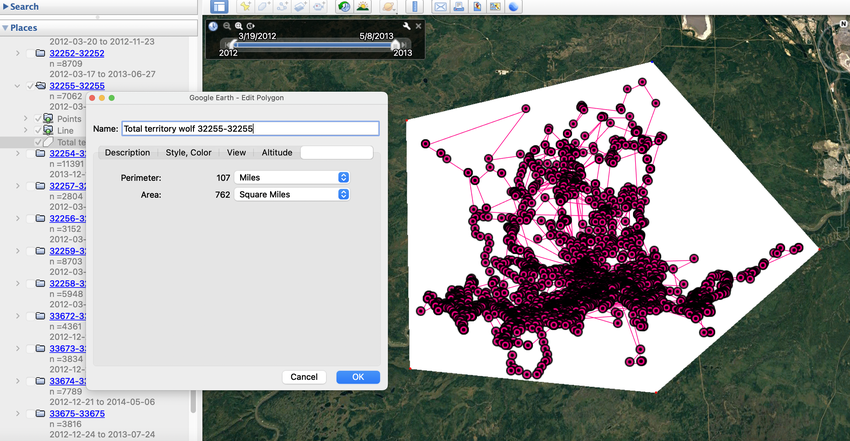
Figure 5. Draw a polygon around all the data points of one wolf to determine its total territory.
- Calculate the fraction (or percentage) of the total territory that the wolves use in each given season.
- Use the wolf track data, the Google Earth map, calculations, and graphs to try to answer these questions. Note: there aren't any "right" or "wrong" answers to these questions. You're simply looking at the data and trying to describe any trends that might be there, and come up with hypotheses to explain those trends. That is exactly what scientists do.
- During which season do the wolves travel the most?
- During which season do they travel the least?
- Can you relate their level of activity to the annual cycle of when breeding, pup birthing, and raising young pups occur?
- Are there any important natural landmarks (water, areas that might have good food, etc.) that you can spot on the map which may explain why they stay in certain areas?
- You may want to test your hypothesis using data from other wolves. The second Variation, listed in the Make It Your Own section, offers a suggestion for two more wolves (in another pack) whose data you could use for hypothesis testing.
/-/https/www.sciencebuddies.org/cdn/Files/18042/8/polygon-in-list.png)
/-/https/www.sciencebuddies.org/cdn/Files/18043/8/total-territory-polygon-area.png)
Troubleshooting
For troubleshooting tips, please read our FAQ: Understanding Wolf Behavior from GPS Tracking Data.
Ask an Expert
Global Goals
The United Nations Sustainable Development Goals (UNSDGs) are a blueprint to achieve a better and more sustainable future for all.
/-/https/www.sciencebuddies.org/cdn/Files/19758/6/E-WEB-Goal-15.png)
Variations
- Based on the tracking data, can you identify which wolves belong to the same wolf pack?
- Plot the data from several wolves associated (in the same time period) with the same pack. How often does the data suggest they travel together versus separately? Does time of year matter?
Frequently Asked Questions (FAQ)
Careers
If you like this project, you might enjoy exploring these related careers:
/-/https/careerdiscovery.sciencebuddies.org/cdn/Files/1900/17/iStock-1191167137.jpg)
/-/https/careerdiscovery.sciencebuddies.org/cdn/Files/17070/11/pexels-photo-5716042.jpg)
/-/https/careerdiscovery.sciencebuddies.org/cdn/Files/1713/17/pexels-photo-3769021.jpg)
/-/https/careerdiscovery.sciencebuddies.org/cdn/Files/967/17/unsplash-d4KQc-ZqBrc.jpg)

/-/https/img.youtube.com/vi/aF--ekfU1ec/0.jpg)
/-/https/img.youtube.com/vi/PszGCm1PqSo/0.jpg)
/-/https/img.youtube.com/vi/WI0pGk0MMhg/0.jpg)