Summary
/-/https/www.sciencebuddies.org/cdn/Files/14031/5/probability-thumbnail.jpg)
/-/https/i.ytimg.com/vi/ONoWZ1rzYJA/maxresdefault.jpg)
Introduction
Have you ever heard anyone say the chance of something happening is "50-50"? What does that actually mean? This phrase has something to do with probability. Probability tells you how likely it is that an event will occur. This means that for certain events you can actually calculate how likely it is that they will happen. In this activity, you will do these calculations and then test if your calculations hold true for reality!
Materials
- Coin
- Six-sided die
- Paper
- Pen or pencil
- Calculator

/-/https/www.sciencebuddies.org/cdn/Files/14032/4/probability-activity-materials.jpg)
Prep Work
- Prepare a tally sheet to count how many times the coin has landed on heads or tails.

- Prepare a second tally sheet to count how often you have rolled each number with the die.

/-/https/www.sciencebuddies.org/cdn/Files/14033/4/tally-sheet-coin.jpg)
/-/https/www.sciencebuddies.org/cdn/Files/14034/4/tally-sheet-die.jpg)
Instructions
- Calculate the theoretical probability for a coin to land on heads or tails, respectively. Write the probabilities in fraction form.
 What is the theoretical probability for each side?
 - Now get ready to toss your coin.Out of the 10 tosses, how often do you expect to get heads or tails?
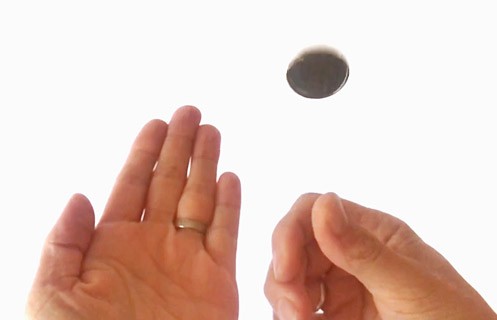
- Toss the coin 10 times. After each toss record if you got heads or tails in your tally sheet.
- Count how often you got heads and how often you got tails. Write your results in fraction form. For example, 3 tails out of 10 tosses would be 3/10 or 0.3. (The denominator will always be the number of times you toss the coin, and the numerator will be the outcome you are measuring, such as the number of times the coin lands on tails.) You could also express the same results looking at heads landings for the same 10 tosses. So that would be 7 heads out of 10 tosses: 7/10 or 0.7.Do your results match your expectations?
- Do another 10 coin tosses.Do you expect the same results? Why or why not?
- Compare your results from the second round with the ones from the first round.Are they the same? Why or why not?
- Continue tossing the coin. This time toss it 30 times in a row. Record your results for each toss in your tally sheet. Look at your results from the 30 coin tosses and convert them into fraction form.How are they different from your previous results for the 10 coin tosses?
- Count how many heads and tails you got for your total coin tosses so far, which should be 50. Again, write your results in fraction form (with the number of tosses as the denominator (50) and the result you are tallying as the numerator).Does your experimental probability match your theoretical probability from the first step?
(An easy way to convert this fraction into a percentage is to multiply the denominator and the numerator each by 2, so 50 x 2 = 100. And after you multiply your numerator by 2, you will have a number that is out of 100—and a percentage.)
- Calculate the theoretical probability for rolling each number on a six-sided die. Write the probabilities in fraction form.What is the theoretical probability for each number?
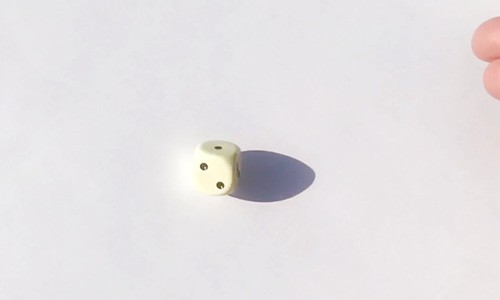
- Take the dice and roll it 10 times. After each roll record which number you got in your tally sheet.Out of the 10 rolls how often do you expect to get each number?
- After 10 rolls compare your results (written in fraction form) with your predictions.How close are they?
- Do another 10 rolls with the dice, recording the result of each roll.Do your results change?
- Now roll the dice 30 times in a row (recording the result after each roll). Count how often you rolled each number in all combined 50 rolls. Write your results in fraction form.Does your experimental probability match your theoretical probability?
(Use the same formula you used for the coin toss, multiplying the denominator and the numerator each by 2 to get the percentage.)
- Compare your calculated probability numbers with your actual data for both activities (coin and dice).What do your combined results tell you about probability?
/-/https/www.sciencebuddies.org/cdn/Files/14035/4/coin-toss.jpg)
/-/https/www.sciencebuddies.org/cdn/Files/14036/4/roll-one-die.jpg)
What Happened?
Calculating the probabilities for tossing a coin is fairly straight-forward. A coin toss has only two possible outcomes: heads or tails. Both outcomes are equally likely. This means that the theoretical probability to get either heads or tails is 0.5 or 50%. The probabilities of all possible outcomes should add up to 1 or 100%, which it does. When you tossed the coin 10 times, however, you most likely did not get five heads and five tails. In reality your results might have been 4 times head and 6 times tail (or another non 5-and-5 result). These numbers would be your experimental probabilities. In this example they are 4 out of 10 (0.4) for heads and 6 out of 10 (0.6) for tails. When you repeated the 10 coin tosses you probably ended up with a different result in the second round. The same was probably true for the 30 coin tosses. Even when you added up all 50 coin tosses you most likely did not end up in a perfectly even probability for heads and tails. Your experimental probabilities thus probably didn't match your calculated (theoretical) probabilities.
You likely observed a similar phenomenon when rolling the dice. Although the theoretical probability for each number is 1 out of 6 (1/6 or 0.167), in reality your experimental probabilities likely looked different. Instead of rolling each number 17% out of your total rolls, you might have rolled them more or less often.
If you continued tossing the coin or rolling the dice, you probably have observed that the more trials (coin tosses or dice rolls) you did, the experimental probability became closer to the theoretical probability. Overall these results mean that even if you know the theoretical probabilities for each possible outcome, you can never know what the actual experimental probabilities will be if there is more than one outcome for an event. After all, a theoretical probability is just predicting how the chances are that an event, or a specific outcome occurs, it won't tell you what will actually happen!
Digging Deeper
Probability allows us to quantify the likelihood an event will occur. You might be familiar with words we use to talk about probability, such as "certain," "likely," "unlikely," "impossible," etcetera. You probably also know that the probability of an event happening spans from impossible, which means that this event will not happen under any circumstance, to certainty, which means that an event will happen without a doubt. In mathematics these extreme probabilities are expressed as 0 (impossible) and 1 (certain). This means a probability number is always a number from 0 to 1. Probability can also be written as a percentage, which is a number from 0% to 100%. The higher the probability number or percentage of an event, the more likely is it that the event will occur.
The probability of a certain event occurring depends on how many possible outcomes the event has. If an event has only one possible outcome, the probability for this outcome is always 1 (or 100%). If there is more than one possible outcome, however, this changes. A simple example is the coin toss. If you toss a coin, there are two possible outcomes (heads or tails). As long as the coin was not manipulated the theoretical probabilities of both outcomes are the same—they are equally probable. The sum of all possible outcomes is always 1 (or 100%) because it is certain that one of the possible outcomes will happen. This means that for the coin toss, the theoretical probability of either heads or tails is 0.5 (or 50%).
It gets more complicated with a six-sided die. In this case if you roll the die, there are 6 possible outcomes (1, 2, 3, 4, 5 or 6). Can you figure out what the theoretical probability for each number is? It is 1/6 or 0.167 (or 16.7%). The interesting part about probabilities is that knowing the theoretical likelihood of a certain outcome doesn't necessarily tell you anything about the experimental probabilities when you actually try it out (except when the probability is 0 or 1). For example, outcomes with very low theoretical probabilities do actually occur in reality although they are very unlikely.
Ask an Expert
For Further Exploration
- Increase the number of coin tosses and dice rolls even further. How do your results compare to the calculated probabilities with increasing number of events (tosses or rolls)?
- Look up how probabilities can be represented by probability trees. Can you draw a probability tree for the coin toss and dice roll?
- If you are interested in more advanced probability calculations, find out how you can calculate the probability of a recurring event, for example: How likely it is that you would get two heads in a row when tossing a coin?
/-/https/www.sciencebuddies.org/cdn/Files/6178/6/playing-cards.jpg)
/-/https/careerdiscovery.sciencebuddies.org/cdn/Files/1442/17/unsplash-TXxiFuQLBKQ.jpg)
/-/https/careerdiscovery.sciencebuddies.org/cdn/Files/1815/24/stat.jpg)
/-/https/careerdiscovery.sciencebuddies.org/cdn/Files/827/18/pexels-photo-3874622.jpg)
/-/https/img.youtube.com/vi/9ZQz2IUEtO8/0.jpg)
/-/https/img.youtube.com/vi/SH3M1WZs7FM/0.jpg)
/-/https/img.youtube.com/vi/M0eTiAE3gI0/0.jpg)