/-/https/www.sciencebuddies.org/cdn/Files/21464/5/sb-logo.png)
/-/https/www.sciencebuddies.org/cdn/Files/21464/5/sb-logo.png)
Forces and Motion
Summary
Svenja Lohner, PhD, Science Buddies
/-/https/www.sciencebuddies.org/cdn/Files/13653/13/forces-motion-main.jpg)
Overview
Students explore how force, mass, and acceleration are related in this hands-on lesson plan. By experimenting with pushing a box across the table while varying force and mass and measuring the box's acceleration with a mobile phone and a sensor app, students discover Newton's second law of motion for themselves.
Learning Objectives
- Understand the relationship between force, mass, and acceleration as described by Newton's second law of motion.
NGSS Alignment
This lesson helps students prepare for these Next Generation Science Standards Performance Expectations:- HS-PS2-1. Analyze data to support the claim that Newton's second law of motion describes the mathematical relationship among the net force on a macroscopic object, its mass, and its acceleration.
|
Science & Engineering Practices
Analyzing and Interpreting Data.
Analyze data using tools, technologies, and/or models (e.g., computational, mathematical) in order to make valid and reliable scientific claims or determine an optimal design solution.
Using Mathematics and Computational Thinking. Use mathematical representations of phenomena to describe explanations. |
Disciplinary Core Ideas
PS2.A: Forces and Motion.
Newton's second law accurately predicts changes in the motion of macroscopic objects.
|
Crosscutting Concepts
Cause and Effect.
Empirical evidence is required to differentiate between cause and correlation and make claims about specific causes and effects. |
Materials
/-/https/www.sciencebuddies.org/cdn/Files/13654/13/forces-motion-materials.jpg)
Materials per group of 4 students:
- Push/pull spring scale, available from Amazon.com
- Small plastic box that fits the mobile device. Note: the box should be sturdy and not bend when force is applied with the spring scale. If it deforms, the applied force is not fully transferred to the box, which will affect the data.
- Scale for measuring mass (can be shared by the whole class)
- Weights (2 x 200 grams)
- Tape
- Smartphone with a sensor app such as phyphox, available for free on Google Play for Android devices (version 4.0 or newer) or from the App Store for iOS devices (iOS 9.0 or newer).
Disclaimer: Science Buddies participates in affiliate programs with Home Science Tools®, Amazon.com, Carolina Biological, and Jameco Electronics. Proceeds from the affiliate programs help support Science Buddies, a 501(c)(3) public charity, and keep our resources free for everyone. Our top priority is student learning. If you have any comments (positive or negative) related to purchases you've made for science projects from recommendations on our site, please let us know. Write to us at [email protected].
Background Information for Teachers
This section contains a quick review for teachers of the science and concepts covered in this lesson.Newton's second law of motion tells us that the net force acting on an object is equal to the object's mass times its acceleration. Mathematically, this can be expressed as the famous equation:
Equation 1:
- F is the force in newtons [N]
- m is the mass in kilograms [kg]
- a is the acceleration in meters per second squared [m/s2]
It is important to remember that in this equation, F is the net, or total, force acting on the object. The classic high school physics example used to demonstrate this is a box subject to an applied force while sliding on the floor, as shown in Figure 1.
/-/https/www.sciencebuddies.org/cdn/Files/13655/8/free-body-box.png)
Figure 1. A free-body diagram of a box being pushed across the floor. The positive x axis points to the right and the positive y axis points up.
This box is subject to four forces:
- The applied force Fapp, which acts in the positive x direction (to the right)
- The frictional force Ff, which acts opposite the direction of motion (so, assuming the box is already moving to the right, it acts to the left, in the negative x direction)
- Its own weight, W, which acts in the negative y direction (downward)
- The normal force, N, from the floor pushing up on the box, which acts in the positive y direction (upward). Assuming the floor is flat, the normal force is exactly equal and opposite to the box's weight.
We can apply Newton's second law to the x and y axes individually. In this lesson we will only look at forces in the x direction. Using Fx to represent the net force in the x direction, analyzing the free body diagram gives:
Equation 2:
In this lesson, your students will apply a known force (Fapp) to a box of known mass using a spring scale. The box will contain a mobile device equipped with a sensor app. The app can use the device's built-in accelerometer to measure acceleration directly.
If you assume friction is negligible (e.g. the box is sliding on a smooth surface), this process lets your students measure all three values in equation 2. They can then plot their data and compare their experimental results to what is predicted theoretically by Newton's second law. Do they see a linear relationship between force, mass, and acceleration?
Additional Background Links
- Newton's Second Law, The Physics Classroom
- Acceleration, The Physics Classroom
Prep Work (30 minutes)
- Make sure you are familiar with the sensor app you are using before you show it to your students. The best way to do this is to play with the app on your phone to get comfortable enough using it to explain it to your students. Ideally, you want to test the experiment yourself with the app before class to make sure it works as intended.
- Do some test trials with the experimental setup to determine the optimal range for the applied force on the box as well as the different masses that you want your students to test.
- Print out a student worksheet for each student.
Teacher Tool Box
Engage (30 minutes)
Note: This lesson assumes that students are familiar with basic kinematics (displacement, velocity, acceleration) and can define forces as a push or a pull or discuss examples of forces such as gravity, normal force, friction, tension, etc. Your students should also have been introduced to the concept of inertia and Newton's first law of motion.
- Place the box that students are going to use for their experiments on a table and ask your students:
 What do I have to do to make this box move?
 Students will most likely say that you have to pull or push the box in one direction.
 - Do as the students suggest and give the box a push or pull with your hands. Then ask:
Why did the object move the way it did?Listen to your student's answers. Elicit responses that mention that a force was applied on the box by either pulling it or pushing it with your hands. The force is what makes the box move.
- Mention to your students that this simple demonstration shows that forces and motion are related.
What other examples do you know that demonstrate that force and motion are related?Students might come up with many different answers. Some common examples are:
- As just demonstrated, when you want to move an object, you have to apply a force.
- When you want to open a door, you have to push or pull on its handle.
- When you want to stop your bike, you must hit the brakes.
- When you...
What does it mean for an object to be in motion?Collect students' answers. If needed, clarify that an object is in motion when it changes its position with respect to its surroundings in a given interval of time. You can describe this motion in terms of velocity or acceleration. Together with your students review the difference between these two terms.- The velocity describes the speed of an object in a certain direction and represents the rate of change of displacement. Velocity is measured in meters per second [m/s].
- The acceleration describes the rate of change in the velocity of the object per unit of time. Acceleration is measured in meters per second squared [m/s²].
- Tell students that in this lesson they will find out how the force that is applied to an object is related to the object's motion. Show them the experimental setup, including the push/pull spring scale.
How can we measure the applied force in this setup?If students don't answer this question correctly, point out that the spring scale is a tool to measure force in newtons [N]. If students are not familiar with spring scales, let them examine one. Have them stretch the spring to feel the different forces.How can we measure the motion of the object?Based on the discussion above, students will probably suggest measuring the object's velocity or acceleration. The velocity of the object can be measured by determining its displacement, i.e. how far it moves, over a certain period of time. The acceleration of the object can be measured with an accelerometer.
- Tell students that they will measure the acceleration of the box with an accelerometer. Explain what an accelerometer is and what it measures. Accelerometers are built into many devices including our mobile devices. Introduce your students to the sensor app you are using, and tell them that the app uses the built-in accelerometer of a mobile device to measure acceleration. Walk your class through a demonstration using the app and introduce them to the accelerometer. When using the phyphox app, choose the "accelerometer with g" function.
- Tap on the Y accelerometer graph to enlarge it and put the phone flat on a table, with the screen facing up. Press the play button and push the phone forward slightly (towards the "top" of the phone, this is the positive Y direction), then press the stop button to stop the recording.
What do we see in the graph? Can you explain what you see?The graph should look something like Figure 2. At first there is a large positive acceleration when the phone is pushed. This occurs because a force is exerted on the phone by pushing it, and the phone's velocity increases. Then, there is a negative acceleration as friction (the force between the phone and the surface of the table) slows the phone down. Note: if you push in the opposite direction—towards the bottom of the phone, in the negative Y direction—then the signs will be reversed, and the graph will be flipped upside-down.
/-/https/www.sciencebuddies.org/cdn/Files/14174/23/note-question-mark-30.png)
/-/https/www.sciencebuddies.org/cdn/Files/14175/24/conversation-bubbles-30.png)
/-/https/www.sciencebuddies.org/cdn/Files/11935/14/accelerometer-pushing.png)
Example graph showing a smartphone's acceleration over time when pushed across a flat surface. The graph increases when the phone is pushed and drastically decreases as the phone comes to a stop before rising again to return to an acceleration of 0. The maximum acceleration reaches about 10 and the minimum acceleration reaches about -8 meters per second squared.
Figure 2. Accelerometer data recorded when pushing the phone on a flat surface. The x-axis of the graph shows time in seconds [s] and the y-axis is acceleration in meters per second squared [m/s²].
- Now hold the phone flat in your hand, with the screen facing up. Press the play button and slowly tilt the phone back and forth a few times in the Y direction, then press the pause button to stop the recording.
What do we see in the graph this time? Can you explain what you see?The graph should look something like Figure 3. This may be confusing to your students at first because the phone was tilting, but not "moving" in the Y direction. This occurs because the accelerometer in the phone can also detect gravity, which points downward. For our experiment, we only want to detect motion in the horizontal direction, so it is important to keep the phone flat and parallel to the ground.
/-/https/www.sciencebuddies.org/cdn/Files/11936/14/accelerometer-tilting.png)
Example graph showing a smartphone's acceleration over time when tilted back and forth. The graph increases when the phone is tilted one way and decreases as the phone tilts the opposite direction. The maximum acceleration reaches bout 4, the minimum acceleration reaches about -3 meters per second squared.
Figure 3. Accelerometer data recorded while tilting the phone back and forth. The x-axis of the graph shows time in seconds [s] and the y-axis is acceleration in meters per second squared [m/s²].
Explore (45 minutes)
- Tell your students that they will use the accelerometer within their sensor app and do different experiments to investigate two different questions.
- How does the applied force affect the object's acceleration?
- How does the object's mass affect its acceleration?
- Before starting with the experiment, let students write their experimental questions as well as their hypotheses down on their worksheets.

- Give students time to familiarize themselves with the sensor app and the accelerometer by moving the mobile device in their hands or on the table. When using phyphox, instruct students to use the accelerometer with g function for their experiments.
/-/https/www.sciencebuddies.org/cdn/Files/11870/13/icon-experiment-45.png)
- In this set of experiments, students vary the applied force on the box but keep its mass constant. Instruct students to select three different force values to test. Remind them that they must keep the mass of the box constant if they are varying the force. Walk students through the steps of the experiment once and then let students carry out their experiments independently. Circulate from group to group and provide support where needed. Encourage students to take turns on different tasks.
- When using the phyphox app, open the acceleration with g sensor and select the X accelerometer graph to enlarge it.
- Place the mobile device in the box with its display facing upwards. The phone should be oriented in a way that it is pushed in the X direction, as shown in Figure 4. You might want to tape the phone inside the box, so it does not move around.
- Press the play button on the accelerometer within phyphox to start a recording.
- Push the bottom end of the spring scale into the spring to a predetermined force value while holding the end of the spring against one side of the box. Keep the box in place with your hand at the opposite end as shown in Figure 4. Make sure that the wall of the box does not deform while applying a force on it.

Figure 4. Experimental setup, showing the mobile device inside the box oriented in its X direction, while a force is applied to the box with a spring scale. - Then release the spring while removing your hand on the other side of the box at the same time.
- Record your observations in the worksheet. Once the box stops moving, stop the accelerometer recording, save your data, and review the graph. The graph should look something like Figure 5. There will be two peaks, one positive and one negative. Which one of the peaks will be positive or negative depends on which way you have pushed the phone. If you push the phone in the opposite direction, then the signs will be reversed, and the graph will be flipped.
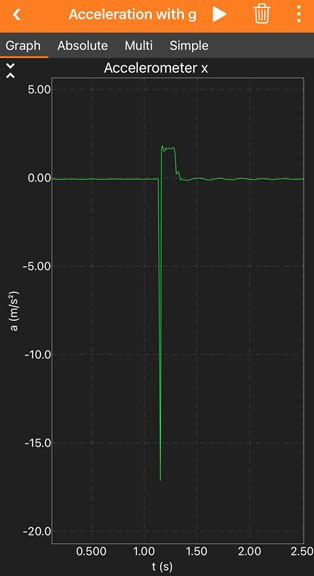
Example graph showing a smartphone's acceleration over time when pushed by a spring. The graph decreases sharply when the spring pushes the phone and then increases sharply as the phone comes to a stop. The minimum value is -17 and the maximum value is 2 meters per second squared.
Figure 5. Accelerometer data recorded when releasing the spring scale and pushing the box with the phone on a flat surface. The x-axis of the graph shows time seconds [s] and the y-axis is acceleration in meters per second squared [m/s²]. - Repeat the measurement 5 times to make sure your data is reproducible. You can either do 5 individual recordings or one recording that includes all 5 trials. If you do individual recordings make sure to save each one before you continue with the next one.
-
View the recording(s) and analyze your data.
You should notice 5 peaks (one for each trial) similar to the one in Figure 5.
Find the maximum acceleration from your graph and write the value in your data table in the worksheet.
In the phyphox app, you can use the pick data tool to select any data point in your recording and view its values. If your first peak is negative, then record the absolute value of that peak minimum as the maximum acceleration. You are only interested in the magnitude of the peaks.
Swipe left to see more
Table 1. Data table to enter the acceleration of the box while pushing it with different forces.Acceleration [m/s²] Force [N] Trial 1 Trial 2 Trial 3 Trial 4 Trial 5 Average
- In the next step, repeat steps c.-h. but change the amount of force that you apply on the box. Again, repeat your measurements 5 times and record your data in your worksheet. In total, test at least three different force values while keeping the mass of the box constant.
/-/https/www.sciencebuddies.org/cdn/Files/13656/9/forces-motion-experimental-setup.png)
/-/https/www.sciencebuddies.org/cdn/Files/13657/13/forces-motion-example-graph-data.jpg)
- In this set of experiments, students vary the mass of the box but keep the applied force on the box constant. Instruct students to select a constant force to use and three different masses to test. Remind them that they must keep the force constant if they are varying the mass. The experimental setup is the same as for the previous experiments (see step 4), except that students add different masses to their box in each experiment while applying the same force.
- Provide a scale to your students so they can measure the exact mass of the box for each experiment, which includes the box, the phone, and the additional weights.
- Advise students to secure the extra weights in the box with tape, so they are not sliding around.
- Make sure students record and save their data with the sensor app, and have them do 5 trials for each measurement.
- Ensure that students review their data, record their observations, and enter their results in the data table provided in their worksheets (Table 2).
| Acceleration [m/s²] | ||||||
|---|---|---|---|---|---|---|
| Mass [g] | Trial 1 | Trial 2 | Trial 3 | Trial 4 | Trial 5 | Average |
Reflect (45 minutes)
- Once all experiments are done, have each group analyze their data. Ensure that all data tables are filled out and have students calculate the average measured acceleration values from their five trials for each of their experiments.
-
In the next step, let your students graph their results.
Have them make two graphs:
- Acceleration (y-axis) versus applied force (x-axis) for constant mass
- Acceleration (y-axis) versus mass (x-axis) for constant force
/-/https/www.sciencebuddies.org/cdn/Files/13659/10/varying-force-varying-mass-example-graphs.png)
Example graphs showing results from measuring acceleration versus force and acceleration over mass. The graph on the left (acceleration over force) is linear, while the graph on the right (acceleration over mass) shows an exponential relationship. The graphs show that as force increases the acceleration also increases at the same rate, and when mass increases the acceleration decreases at a slower rate.
Figure 6. Example data showing results from measuring acceleration versus force (left) and acceleration versus mass (right). Trendlines (linear or potential fit) can be added to the data in order to identify the relationship between the plotted parameters.
- Based on their data ask them to discuss the following questions.
Compare your results for different applied forces when mass was held constant. As you double or triple the force on the box, how does its acceleration change?Note: If your students need a hint, ask them to draw a best-fit line on the graph, then calculate the slope of that line. For a graph of acceleration versus force, the slope should be 1/mass (as shown in Figure 7 on the left).What is the relationship between the applied force (F) and the acceleration (a)? Justify your answer with data from your data table or graph.Compare you results for different masses when force was held constant. As you double or triple the mass of the box, how does its acceleration change?Note: This relationship is harder to infer from the graph as it is an inverse relationship (1/x). Encourage your students to try different fits (linear, exponential , etc.) or have them plot acceleration versus 1/mass, so they can see a linear relationship there.What is the relationship between the mass of the box (m) and its acceleration (a)? Justify your answer with data from your data table or graph.Based on your findings, can you come up with an equation that links force, acceleration, and mass?
- Gather the whole class and ask students what equation they have come up with. Then write the equation on the board for everyone to see: F = ma (or a = F/m). Explain that this is Newton's second law of motion.
- Have students restate what this equation means. Ask them to compare the values for F and ma for each of their experiments. Is F really equal to ma?
- If there are discrepancies in the values, ask your students why this would be the case. Ask them which forces act on the box, what the actual net force that accelerates the box is composed of, etc. To do this, it might help to make a free body drawing and indicate the acting forces on the box (see Figure 1 in the teacher background). Also discuss other potential experimental errors such as the box flexing while pushing it with the spring scale, which reduces the transferred force on the box, or their hands not holding still and accidentally pushing the box, or the limited sensor sampling rate, as discussed above.
- Close the lesson by asking your students how Newton's second law of motion applies to real life.
How does the relationship between force, mass, and acceleration affect you in everyday life?
Assess
You can use this quiz to assess student learning after the activity:
- Online quiz, assignable in any LMS
- Quiz (pdf) and answer key (PDF)
Make Career Connections
Discussing or reading about these careers can help students make important connections between the in-class lesson and STEM job opportunities in the real world.
/-/https/careerdiscovery.sciencebuddies.org/cdn/Files/1640/26/Fyysikot_tyossaan.jpg)

/-/https/careerdiscovery.sciencebuddies.org/cdn/Files/1450/21/iStock-1227179796.jpg)
Lesson Plan Variations
- Instead of a box, have students push a self-made car with their spring scale to measure the acceleration of their car. You can find instructions on how to do this in Science Buddies' Push Harder — Newton's Second Law lesson.
- Try to push or pull the box while keeping the acceleration constant (this can be difficult!) and measure the force with the spring scale.
- Try to push or pull the box with a constant velocity and measure the applied force with the spring scale. Note that this is a special case of the previous point (acceleration is zero), and the force applied by the spring scale will be exactly equal to the friction force.
- While recording the acceleration with a sensor app, give the box a strong push (you do not need to use the spring scale), and then let it slide to a stop. While it is sliding, friction is the only horizontal force acting on the box. Measuring the acceleration as it slides gives you another way to calculate the frictional force.
/-/https/img.youtube.com/vi/qUo6hXSV1b8/0.jpg)
/-/https/img.youtube.com/vi/P6PGedCKrUM/0.jpg)
/-/https/img.youtube.com/vi/l-VWX6ndGpA/0.jpg)