Tracking SARS-CoV-2 Spread from Wastewater
Abstract
Have you ever wanted to know where hot spots of infection are or see how viruses spread? Are you interested in seeing how this changes over time? Check out our new science project that uses data visualization tools and tested wastewater data to track the virus that causes COVID-19 over time.
Summary
None
Readily available
No issues
/-/https/www.sciencebuddies.org/cdn/Files/4761/62/youtube.jpg)
Objective
Compare COVID-19 wastewater data from a selected state and counties to national data to identify similarities, differences, and trends over time.
Introduction
Tracking infections can often be challenging. In the field of infectious diseases, medical professionals and epidemiologists can track an infectious disease by measuring its viral load, or the amount of the virus in a person, such as by using a rapid antibody test. However, this type of testing requires taking samples from individual people. To enable more rapid tracking of infections, methods have been developed to detect viruses in wastewater. This approach has been used by the U.S. Centers for Disease Control and Prevention (CDC) to monitor the spread of viruses in our wastewater.
How can the CDC detect these small viruses? To understand the answer, it is important to understand the composition of viruses. All viruses contain genetic material, specifically made of deoxyribonucleic acid (DNA) or ribonucleic acid (RNA). The genetic material includes instructions for creating more viruses, allowing them to replicate and spread. The genetic material can be surrounded by a shell-like layer of proteins and lipids, together called an envelope. The severe acute respiratory syndrome coronavirus 2 (SARS-CoV-2) is the virus that causes Coronavirus disease (COVID-19). The SARS-CoV-2 virus is comprised of an envelope surrounding RNA as its genetic material, as shown in Figure 1.
/-/https/www.sciencebuddies.org/cdn/Files/21933/5/SARS-CoV-2.jpg)
Schematic drawing of the SARS-CoV2 virus that causes COVID-19.
How can scientists detect and quantify the viral genetic material? Scientists discovered that viral genetic material, such as SARS-CoV-2 RNA, can be detected and quantified in wastewater, reducing the need to collect potentially infectious samples directly from people to monitor how viruses spread throughout a population. Certain laboratory tests, such as polymerase chain reaction (PCR), can detect even tiny amounts of DNA or RNA in a sample. Using such a test and enough representative samples, scientists can infer how much virus is likely present in a given area or total population. However, this method has limitations. For example, not every viral particle in the wastewater corresponds to one or even a clearly defined number of human infections. But despite this method being less accurate for measuring active infections, it is still a less invasive, safer, and potentially more sensitive way to monitor highly infectious viruses.
In this science project, you will use CDC wastewater sample testing results to investigate how SARS-CoV-2 spreads across a state in the United States. Using a SARS-CoV-2 RNA-based test method, how can the virus be detected in wastewater samples and monitored for local changes to reveal how this virus can spread over time?
Terms and Concepts
- Infectious disease
- Epidemiologist
- Viral load
- Viruses
- U.S. Centers for Disease Control and Prevention (CDC)
- Deoxyribonucleic acids (DNA)
- Ribonucleic acid (RNA)
- Proteins
- Lipids
- Envelope
- Severe acute respiratory syndrome coronavirus 2 (Sars-CoV2)
- Coronavirus disease (COVID-19)
- Polymerase chain reaction (PCR)
Questions
- What are viruses composed of?
- How has the SARS-CoV-2 virus been monitored in the past?
- Who monitors infectious diseases and their outbreaks?
- What are the advantages of testing for viruses in wastewater over measuring viral load in individual people? What are the potential limitations of wastewater testing?
- How do you predict that the levels of virus will change over time as the virus spreads, based on what you know about the COVID-19 pandemic?
Bibliography
- CDC. (n.d.) National Wastewater Surveillance System (NWSS): COVID-19 National Wastewater Data. Retrieved November 25, 2025.
- CDC. (n.d.) Coronavirus Disease 2019 (COVID-19) | Covid | CDC. Retrieved April 15, 2026.
Materials and Equipment
Experimental Procedure
In this experiment, you will look at how COVID-19 viral DNA levels in wastewater change over time, across the nation and within a select state. To do this, you’ll first pick a state of interest and use the coding instructions below to help you visualize COVID-19 viral DNA levels from wastewater data in multiple counties across the state. You’ll then be able to visually see how the COVID-19 pandemic changed over that time, and use quantitative measurements to reinforce the visualization.
Setting Up the Google Colab Environment
- You will need a Google account. If you do not have one, make one when prompted.
- Download the covid_wastewater.ipynb file from Science Buddies. This is the code you will need to process your data.
- Download the wastewater data from the CDC website. This is data on COVID-19 wastewater testing results and the counties where they were collected. To do this, click Export and ensure the Export format is CSV. In your downloads, rename this file to
wastewater.csv. - Download the uscounties.csv file. This data contains the names of US counties and their country codes. We will use this file to plot data on the US map.
- Within your Google Drive, click on ‘MyDrive,’ then create a new folder and rename it
covid_wastewater. In this new folder, upload the wastewater.csv, uscounties.csv, and covid_wastewater.ipynb files. - Double-click on the
covid_wastewater.ipynbfile. This should automatically open in Google Colab.- Read the Troubleshooting Tips and How to Use This Notebook sections. Follow the instructions you find in that section.
- Run the block under Importing Libraries to ensure you have access to all the functions we will use for this project.
- Tip: To run each code block, you can either press the play button to the left of each code block or click on the code block and then hold Shift + Enter on your keyboard.
Loading the Data into a Pandas DataFrame and Preprocessing
- (Code Block 1A) Run this code block to create a DataFrame, which is essentially a data table, to load and manipulate the data in the notebook. The data from your
wastewater.csvfile will populate a table below the code block. Run this code block. - (Code Block 1B) This code block displays the number of data points available for each state. When choosing the state you want to focus on, consider picking one with more data. Run this code block.
- (Code Block 1C) This code block shows the years of available data for each state. Note that some states do not have data for consecutive years. When selecting a state, it is best to choose one with more than three years of data and, ideally, a continuous sequence of years. For example, some states may have data for 2022, 2023, and 2025, but not 2024. Run this code block.
- (Code Block 1D) This code block sorts states by the number of years of available data and then by the total number of data rows. States near the top of the list are typically better choices because they tend to have more complete data and more consistent reporting; however, this is not a strict requirement. Aim to select a state with at least three years of data and more than 5,000 rows.
Preprocessing
- (Code Block 2A) First, we can filter the data by the state of interest. Under the
#TODOcomment, you can define the state you are interested in by the state abbreviation. For example, if you are interested in Pennsylvania, you can type in“pa”. Make sure both letters are lowercase. You can do a simple Google search to find your state abbreviation if you don't already know it.
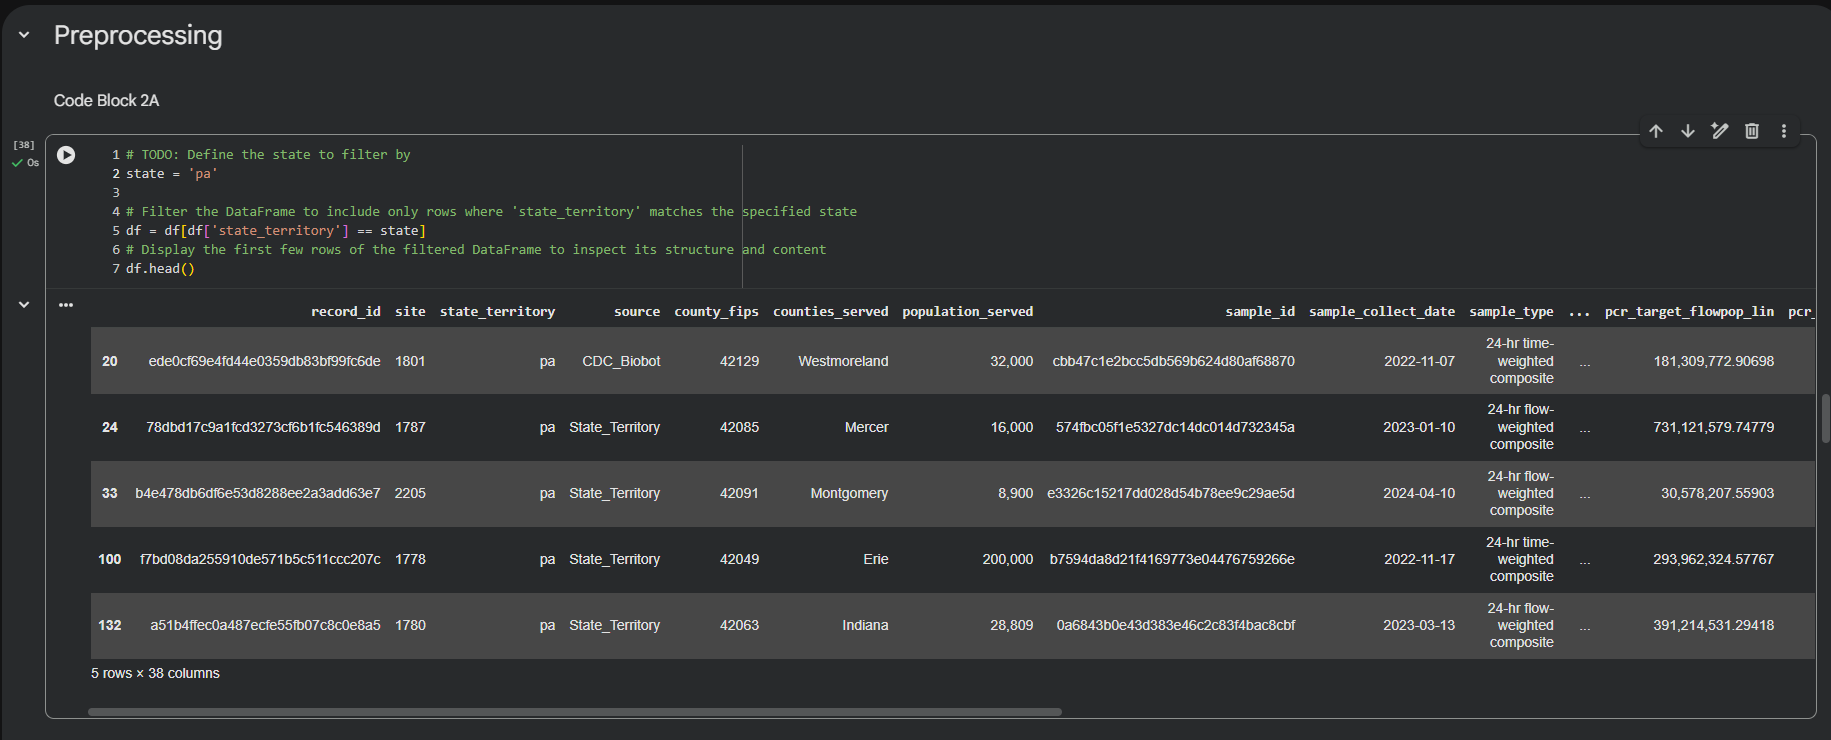
Figure 1. Example of the code block that filters the DataFrame by a given state. You can change the state by updating thestatevariable under the#TODOcomment. - (Code Blocks 2B–2F) These code blocks get the data ready so we can display it on a map more easily. You do not need to understand the code in these code blocks. Run all of these code blocks.
/-/https/www.sciencebuddies.org/cdn/Files/21936/4/mceclip0.png)
Displaying COVID-19 Levels on a Map
Here, you will use the DataFrame you just generated to create a map display to visually analyze trends.
- (Code Block 3A) This code block defines a function that displays COVID-19 PCR target concentrations from wastewater levels on a map. Run this code block.
- (Code Block 3B) This code block defines a function that will display the average PCR target concentration nationwide and for the state given a year. Run this code block.
- (Code Block 3C-3D) Under the
#TODOcomment, you can change the year to display maps for different years. Run this code block to view a map of PCR target concentrations for the state you selected earlier in Code Block 2A. You can also click on the circles on the map to view data for individual counties. Code Blocks 3C and 3D contain the same code, but they are included twice, so you can generate maps for two different years and compare how PCR concentrations may have changed over time.
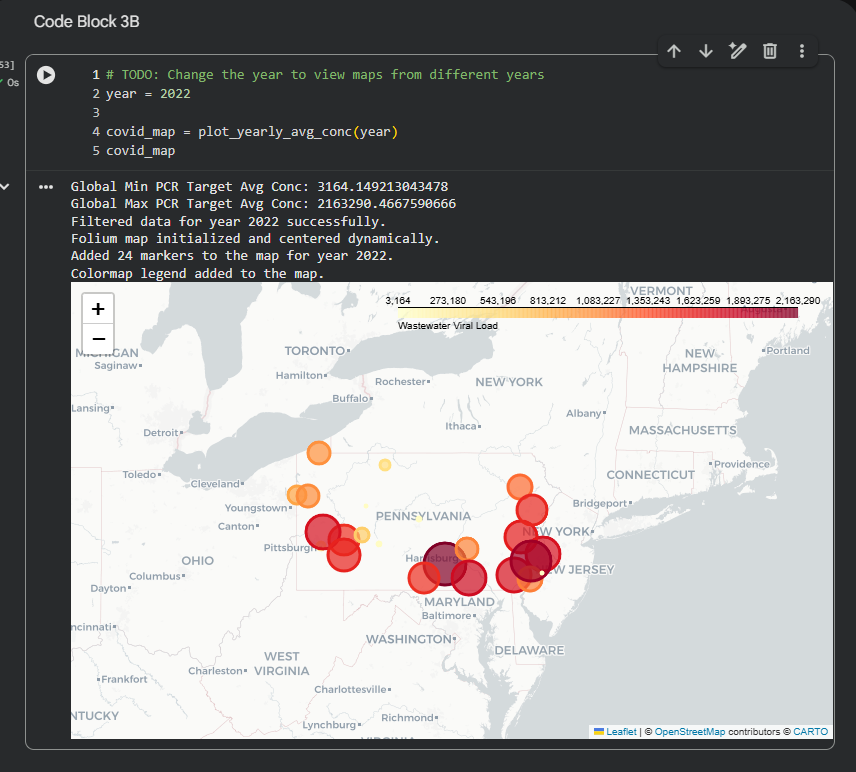
Figure 2. Example of what the map should look like. Bigger, darker circles indicate higher concentrations of the PCR target.
- If you see an error, it is most likely because there is no data for the year you entered. For example, if your selected state only has data from 2022 to 2026 and you enter 2021, the code will return an error.
- (Code Block 3E-3F) Under the
#TODOcomment, update the year and state abbreviation to print the yearly average COVID-19 PCR target concentration. The output will show both the selected state’s concentration and the national concentration. Code Blocks 3E and 3F contain the same code and are provided twice so you can easily compare concentration levels between two different years.- If you encounter an error, it is most likely because no data is available for the year you entered. Also, check that the state abbreviation is correct.
- In a notebook, document, or spreadsheet, create a table like the one below. Using Code Blocks 3E-3F, fill out this table. This will help you compare your state's data to national data.
- How does the PCR concentration of your given state compare to the nation? Is it higher or lower?
- Can you think of any reasons why certain states/communities may be more impacted by COVID-19 than others?
/-/https/www.sciencebuddies.org/cdn/Files/21937/4/mceclip1.png)
| Year | Average State Data | Average National Data |
|---|---|---|
| 2022 | ||
| 2023 | ||
| 2024 | ||
| 2025 | ||
| 2026 |
Displaying County Data
Here, you will use the DataFrame you generated to determine the PCR concentration in select counties over time.
- (Code Block 4A) This code block displays the counties in the state you selected, the years for which each county has data, and the county_fips code. FIPS stands for Federal Information Processing Standards and uniquely identifies each county. Run this code block.
- (Code Block 4B) This code block defines a helper function that will print out the average PCR concentration for each year, given the county_fips code. Run this code block.
- (Code Block 4C) This code block will use the helper function defined in Code Block 4B. Under the #TODO comment, enter the county FIPS code for the county you want to see the yearly average PCR concentration for.
- Create another table like the one below. Select 5 counties you are interested in. Remember that you can see the list of counties for your selected state under Code Block 4A, and the yearly average PCR concentration for any county you’re interested in under Code Block 4C. Fill out this table.
- How does the PCR concentration differ from county to county?
- Does the county with the most PCR concentration differ from year to year?
Swipe left to see moreTable 2. County overview of COVID-19 PCR concentrations over time. Year County 1 County 2 County 3 County 4 County 5 Average 2022 2023 2024 2025 2026
- (Optional) (Code Block 4D) This code block displays a histogram of PCR target concentration over time. Under the #TODO comment, enter the county FIPS code for the county you want to examine.
- After viewing the histogram, look for a trend. Does the PCR target concentration appear to be increasing, decreasing, or staying about the same over time?
Review the data and develop conclusions based on the information.
- How did the spread of SARS-CoV-2 change in wastewater in the state you chose year-over-year?
- What year(s) did the concentration of SARS-CoV-2 in wastewater drastically change in the state?
- When was the peak of Sar-CoV-2 spreading in this date range? This can be considered the height of the pandemic. When was the lowest SARS-CoV-2 spread? This can be considered the endemic phase of the virus.
- Take it a step further and cross-reference this information with when infection rates were highest or at the height of the pandemic. This information can be found online, as it was publicly announced by the CDC.
- Investigate further when the SARS-CoV-2 virus was announced as endemic by the CDC. Does this align with the wastewater data, and what’s expected in an endemic virus (e.g. cold, flu)?
- How did the concentration of SARS-CoV-2 change in wastewater in each county you chose year-over-year? When you compare two counties, which had higher levels over time, or did they stagger as if the virus was being spread from one area to the next?
- What year did the concentration of SARS-CoV-2 in wastewater drastically change (increase or decrease) in the county or each county?
- Take it a step further, and investigate if there is a large population difference between the counties you compared. Why would this matter based on what you know about how SARS-CoV-2 is predominantly transmitted (refer to the introduction)?
- How did the local or regional wastewater data (in the county) compare to the state-level trends? Why do you think there are similarities or differences?
Ask an Expert
Global Goals
The United Nations Sustainable Development Goals (UNSDGs) are a blueprint to achieve a better and more sustainable future for all.
/-/https/www.sciencebuddies.org/cdn/Files/19746/5/E-WEB-Goal-03.png)
Variations
- Compare the amount of virus released in wastewater to the total number of infected individuals in an area. How do these numbers compare, and what does that tell you about this method of surveilling for confirmed cases of COVID-19 infection? Does the wastewater underepresent or overrepresent the number of confirmed cases of SARS-CoV-2 infection? How would unreported SAR-CoV-2 cases impact predictions of virus spread or infection rates?
- Take it a step further to look into when the virus likely transitioned from a highly prevalent epidemic virus to a less prevalent or endemic virus? Cross-reference the wastewater data with SARS-CoV-2 infection rates to inform any conclusions.
- Where are specific COVID-19 variants most prevalent across the U.S.? Use COVID-19 variant data from the CDC to investigate this question.
- Compare these results to other infectious viruses using the CDC’S new Wastewater Viral Activity Level (WVAL) data.
- Compare this data to clinical data to see if they show similar trends. Use level of respiratory illness activity data from the CDC that is actively monitoring respiratory illnesses, using data reporting the rate at which people are visiting the emergency department for these infections.
- Is there a risk of COVID-19 becoming a pandemic again in the future? Use the CDC’s epidemic trends data set to better understand where there are increasing and decreasing rates of both COVID-19 and the flu.
Careers
If you like this project, you might enjoy exploring these related careers:
/-/https/careerdiscovery.sciencebuddies.org/cdn/Files/1294/17/iStock-1207951880.jpg)
/-/https/careerdiscovery.sciencebuddies.org/cdn/Files/1628/18/iStock-1203995945.jpg)
/-/https/careerdiscovery.sciencebuddies.org/cdn/Files/1365/18/iStock-1012791028.jpg)

/-/https/img.youtube.com/vi/I7MrL5Q7zvY/0.jpg)
/-/https/img.youtube.com/vi/h1Vs6_3PXY4/0.jpg)
/-/https/img.youtube.com/vi/6KttMKX17YE/0.jpg)