Abstract
Have you ever been told to avoid certain foods because they contain too much fat? Almost every food we eat has some amount of fat in it; often in an invisible form so we do not even notice. However, eating healthy does not mean getting rid of all fat in your diet. On the contrary, fat is an essential nutrient for your body! Only consuming too much of certain fat types creates problems. Are you curious about how to determine the fat content of different foods? Gather some chips, chocolate, and nuts and do this science project to find out!
Summary
Some familiarity with basic organic chemistry including hydrocarbons and the different types of carbon bonds would be helpful, though it is not required for this project.
Readily available
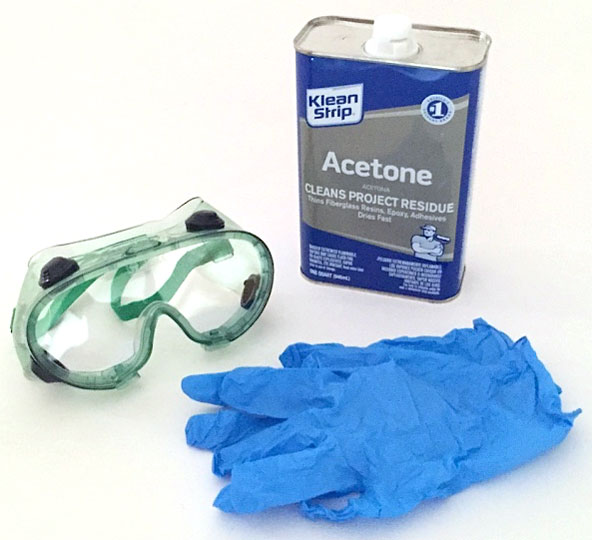
Acetone is a flammable liquid. Keep away from open flames, sparks, or heat. Acetone is irritating to skin and eyes. Be sure to wear safety goggles and gloves. Work in an area with adequate ventilation. Adult supervision is recommended. Do NOT eat the foods that you treated with acetone.
This project idea is based on a food science experiment from the Institute of Food Technologists.
/-/https/www.sciencebuddies.org/cdn/Files/7774/11/thumbnail-fat-extraction.jpg)
Objective
Investigate how much fat and what fat types are in different foods.
Introduction
/-/https/www.sciencebuddies.org/cdn/Files/7774/11/thumbnail-fat-extraction.jpg)
A balanced diet is crucial for staying healthy and means eating the right ratio of the three main macronutrients: fat, protein, and carbohydrates. If you eat too much of one component, it can have serious consequences. For example, high fat consumption has been associated with an increased risk of heart disease and obesity. However, choosing the right foods can be tricky, especially with processed foods because it is not always obvious what they contain without reading the nutrition labels. Or can you estimate by just looking at a food how much fat it contains? Probably not, because often fats in food are hidden as so-called "invisible fats". Some examples of foods that contain visible and invisible fats are shown in Figure 1.
/-/https/www.sciencebuddies.org/cdn/Files/7752/10/foods-visible-invisible-fats.jpg)
Figure 1. Almost every food contains fat in visible or invisible form. (Image credits: olive oil by Benprofaci; butter (modified) by Renee Comet; meat (modified) by MCB at English Wikipedia; avocado by Marco Finke; edited by Merops; almonds by NMajik at English Wikipedia; potato chips by Paul Hurst; all via Wikimedia Commons)
In a healthy diet, 20–30 percent of your calorie intake should consist of fat. But why do we need that much fat? Our body uses fat for lots of purposes, such as storing energy or digesting essential fat-soluble vitamins. In addition, body fat functions as an insulation layer to maintain our body temperature and it also protects our organs. So why do we hear all these stories about bad fats that are unhealthy? The reason is that there are different types of fats in foods and not all of them are healthy. All fats are based on a similar chemical structure and are derivatives of fatty acids and glycerol. Fatty acids are molecules with a carboxyl group head (made of carbon, oxygen and hydrogen) followed by a long hydrocarbon chain, which consists of carbon and hydrogen atoms. When three of these fatty acids bond to the glycerol molecule, they form a fat molecule, also called triglyceride, as shown in Figure 2. Depending on what kind of fatty acids bind to the glycerol molecule, the resulting fats can have very different properties. Fatty acids can differ by length and type of carbon-carbon bonds they have. If the fatty acids contain one or more double bonds in their chain structure, they are called unsaturated fatty acids, if there are no double bonds present, they are called saturated fatty acids. Fats that are liquid at room temperature, or oils, tend to have a higher content of unsaturated fatty acids and also shorter hydrocarbon chains. This is due to the fact that the double bonds in unsaturated fats disturb the compact layering of the long fatty acid molecules, resulting in weaker attractive forces between the hydrocarbon chains—also called Van der Waals forces—that hold them together.
/-/https/www.sciencebuddies.org/cdn/Files/7753/11/triglyceride-formation.png)
A diagram shows the chemical structures of various types of molecules and how they interact with each other. Fatty acids can be categorized into three categories: saturated, monounsaturated and polyunsaturated. These categories differ based on how many douhle bonds are present in a fatty acids hydrocarbon chain. Three fatty acids can also bond with a glycerol molecule to form a triglyceride.
Figure 2. Fatty acids, such as palmitic acid, are carboxylic acids with long hydrocarbon chains. Fats, or triglycerides, are chemical compounds—also called esters—that are derived from three fatty acid molecules and glycerol (an alcohol). Depending on the molecular structure of the fatty acids, fats are called unsaturated or saturated. The fat in this figure is unsaturated, as it shows double bonds in its hydrocarbon chain structure.
So which one of these is "bad" and which one is "good" for human health? Unsaturated fats are mostly found in plant-based foods and oils, and tend to be liquid at room temperature. In general, they have been shown to be beneficial to your health by improving blood cholesterol levels and blood sugar control. In contrast, saturated fats, which mainly come from animal sources, have been associated with elevated cholesterol levels and increase in heart diseases. In particular, so-called trans fats, which are derived from food processing and do not occur in nature, should be avoided in a healthy diet. Most fats that include a high percentage of saturated fats or trans fats are solid at room temperature.
But how can you find out which type of fats are present in your food? To do this, you first have to separate the fats from the food using a method called solvent extraction. In this procedure, only the fat components of the food sample are dissolved and extracted using a specific solvent. In a second step of the procedure, the solvent evaporates while leaving the extracted fats behind. You can learn more about the solvent in the following technical note. In this science project, you will use acetone as a solvent to extract fats from potato chips, chocolate, and almonds. Which food do you think contains the most fats and is healthiest for you?
Terms and Concepts
- Macronutrient
- Fat
- Invisible fat
- Fatty acid
- Glycerol
- Carboxylic acid
- Hydrocarbon
- Triglyceride
- Double bond
- Unsaturated fatty acid
- Saturated fatty acid
- Oil
- Ester
- Trans fat
- Solvent extraction
Questions
- What kind of foods contain visible versus invisible fats?
- What function does fat have in our bodies and how is it metabolized?
- How is fat synthesized and where do fats occur in nature?
- What are trans fats and why are they controversial?
- What is the difference between unsaturated, saturated, and trans fats?
- How do different fats affect human health and what does a "high cholesterol" level mean?
Bibliography
- SciShow (2015). The Deal with Fat. Retrieved March 28, 2016.
- Mayo Clinic. (2016). Nutrition and healthy eating. Retrieved March 22, 2016.
- Scientific American. (2013). The scientific case for banning trans fats. Retrieved March 22, 2016.
- TedEd, Zaidan G. (n.d.). What is fat?. Retrieved March 22, 2016.
Materials and Equipment
- Mason jars (18), 8 oz
- Permanent marker
- Masking tape
- Hammer
- Foods to test (potato chips, almonds [skinned and slivered], bittersweet chocolate chips)
- Small, sturdy plastic baggies (sealable) (9)
- Digital scale with 0.1 g increments. A digital scale that would be suitable is the Digital Pocket Scale, 500 g x 0.1 g; available from Home Science Tools®
- Safety goggles; available from Home Science Tools®
- Latex gloves; available from Home Science Tools®
- Acetone (approximately 500 mL); available at your local hardware store
- Graduated cylinder, 50 mL; available from Home Science Tools®
- Small, fine-meshed strainer
- Large box in which you can fit all your jars
- Cheesecloth or other small meshed netting (large enough to fit over the box); available from Home Science Tools®
- Timer
- Pen
- Lab notebook
Disclaimer: Science Buddies participates in affiliate programs with Home Science Tools®, Amazon.com, Carolina Biological, and Jameco Electronics. Proceeds from the affiliate programs help support Science Buddies, a 501(c)(3) public charity, and keep our resources free for everyone. Our top priority is student learning. If you have any comments (positive or negative) related to purchases you've made for science projects from recommendations on our site, please let us know. Write to us at [email protected].
Experimental Procedure
Preparing Your Samples
Follow these step-by-step instructions and click through the slideshow to see how to prepare your food samples for the fat extraction. Although the slideshow shows only one replicate per food, you will do three separate trials (replicates) for each food in this experiment.
/-/https/www.sciencebuddies.org/cdn/Files/7766/7/slideshow-9-prepare-crushed-food-in-jars.jpg)
/-/https/www.sciencebuddies.org/cdn/Files/7757/7/slideshow-1-prepare-materials.jpg)
/-/https/www.sciencebuddies.org/cdn/Files/7759/7/slideshow-2-prepare-labeling-jars.jpg)
/-/https/www.sciencebuddies.org/cdn/Files/7761/7/slideshow-4-prepare-weighing-food.jpg)
/-/https/www.sciencebuddies.org/cdn/Files/7762/7/slideshow-5-prepare-food-in-bags.jpg)
/-/https/www.sciencebuddies.org/cdn/Files/7763/7/slideshow-6-prepare-crushing-food.jpg)
/-/https/www.sciencebuddies.org/cdn/Files/7764/7/slideshow-7-prepare-crushing-foods.jpg)
/-/https/www.sciencebuddies.org/cdn/Files/7765/7/slideshow-8-prepare-weighing-crushed-foods.jpg)
Slideshow with step-by-step instructions viewable online.
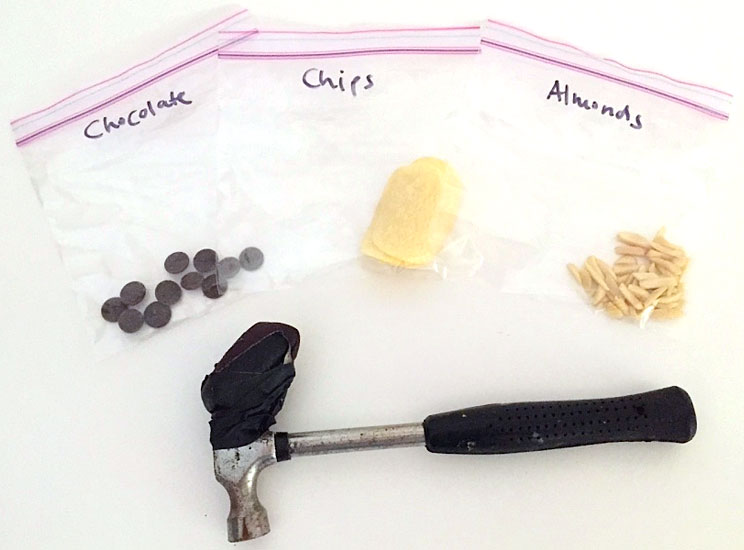
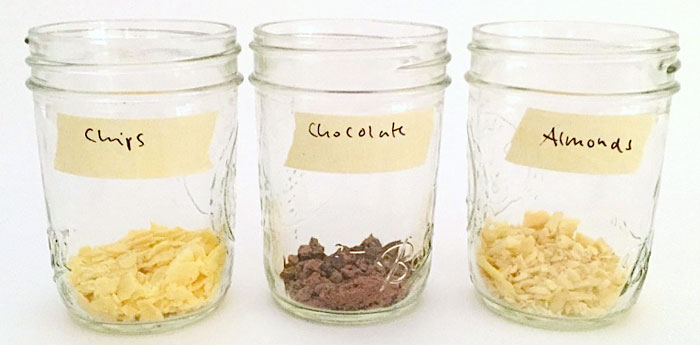
- Use the masking tape and permanent marker to label all your Mason jars. You will run three trials per food.
- For each food (almonds, potato chips, and chocolate), label three jars and give each set a trial number (1, 2, and 3).
- Label three more jars per food with almond acetone, potato chips acetone, and chocolate acetone. Again, add the trial numbers to the label. These jars will be used for collecting the extracted fat.
- Use the digital scale to weigh each of the Mason jars (without the lid). Make a data table, such as Table 1, in your lab notebook in which to record their masses.
- Use the digital scale to weigh 10 grams (g) of potato chips into each of the three Mason jars that are labeled with potato chips. Do the same thing for the almonds and the chocolate chips. Keep the packaging of all foods you use in your test.
- Label all nine sealable baggies with the food names and respective trial numbers.
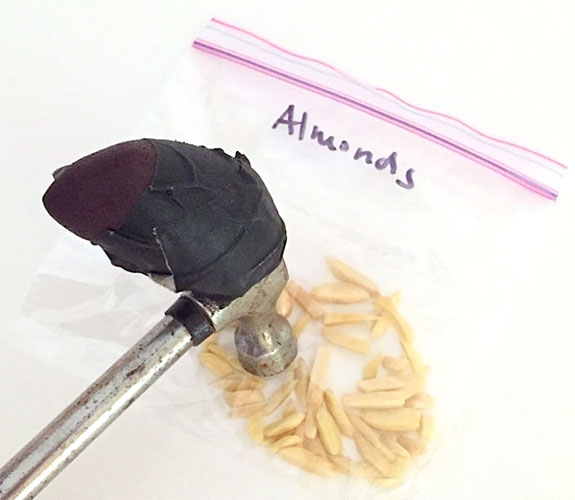
- Pour each of the foods (each trial separately) from the Mason jars into the labeled plastic baggies and close them tightly. Make sure nothing is left in the Mason jars. Use a hammer to crush all the potato chip, almond, and chocolate chip samples into smaller pieces, as shown for one trial in Figure 3. Note: Do not pound too hard or you will get holes in your baggies. Make sure you protect your work area before using the hammer.
/-/https/www.sciencebuddies.org/cdn/Files/7754/10/crushed-foods.jpg)
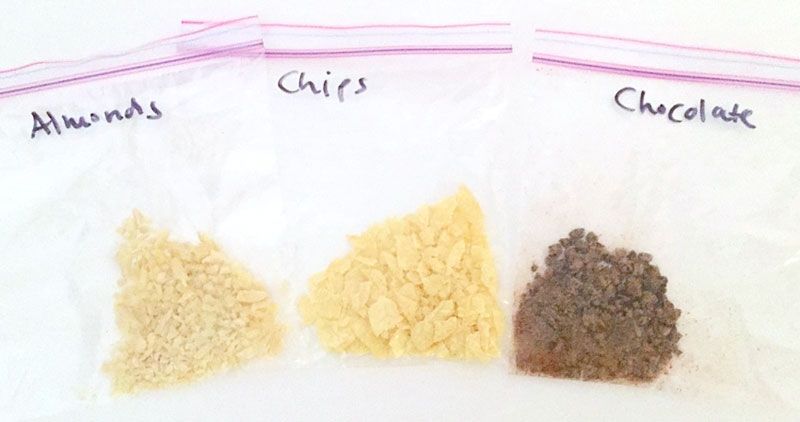
Figure 3. Each food is crushed into small pieces with a hammer. In this figure only one set of food is shown; you will have three baggies of food per trial.
- Once all the food is crushed, put it back into the labeled Mason jars.
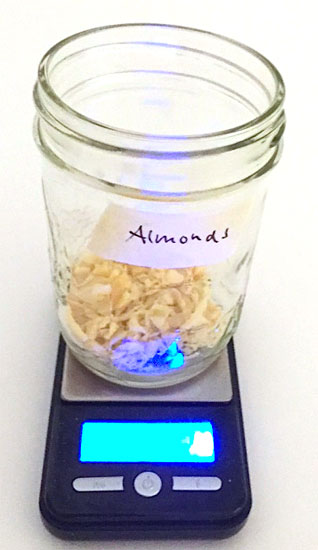
- Weigh each Mason jar filled with the crushed food again on the digital scale and record its mass in your data table.
| Trial # | Mass of empty jar [g] | Mass of jar with crushed food before extraction [g] | Mass of crushed food [g] | Mass of jar after extraction (no acetone left) [g] | Mass difference before and after extraction [g] | Fat extracted [%] | Fat content from nutrition label [%] | Extraction efficiency [%] | |
|---|---|---|---|---|---|---|---|---|---|
| Potato chips | 1 | ||||||||
| 2 | |||||||||
| 3 | |||||||||
| Chocolate | 1 | ||||||||
| 2 | |||||||||
| 3 | |||||||||
| Almonds | 1 | ||||||||
| 2 | |||||||||
| 3 | |||||||||
| Potato chips acetone | 1 | empty | empty | empty | empty | empty | |||
| 2 | |||||||||
| 3 | |||||||||
| Chocolate acetone | 1 | empty | empty | empty | empty | empty | |||
| 2 | |||||||||
| 3 | |||||||||
| Almonds acetone | 1 | empty | empty | empty | empty | empty | |||
| 2 | |||||||||
| 3 |
Table 1. Data table in which to record your data throughout the experiment.
Extracting the Fats from the Foods
To extract the fats from your crushed foods, follow these step-by-step instructions and click through the slideshow to see how to do the solvent extraction.
/-/https/www.sciencebuddies.org/cdn/Files/7772/7/slideshow-6-extract-weighing-fat.jpg)
/-/https/www.sciencebuddies.org/cdn/Files/7768/7/slideshow-2-extract-adding-acetone-to-food.jpg)
/-/https/www.sciencebuddies.org/cdn/Files/7769/7/slideshow-3-extract-swirling-food.jpg)
/-/https/www.sciencebuddies.org/cdn/Files/7770/7/slideshow-4-extract-decanting-acetone.jpg)
/-/https/www.sciencebuddies.org/cdn/Files/7771/7/slideshow-5-extract-all-jars-after-extraction.jpg)
Slideshow with step-by-step instructions viewable online.
- Before you start working with the acetone, make sure there are no open flames close by, and put on your safety goggles and latex gloves. You should also work in a well-ventilated area, preferably outside. Be sure to protect your work surface, as some acetone might get spilled.
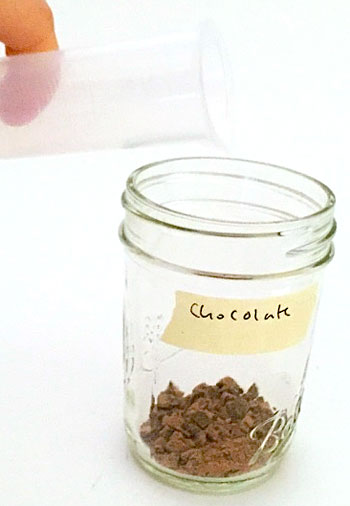
- Measure out 20 mL of acetone in the graduated cylinder and pour it into one of the Mason jars with the crushed potato chips. You will do one trial at a time, as you cannot swirl all the jars at once. The Introduction explains why you use acetone as the solvent.
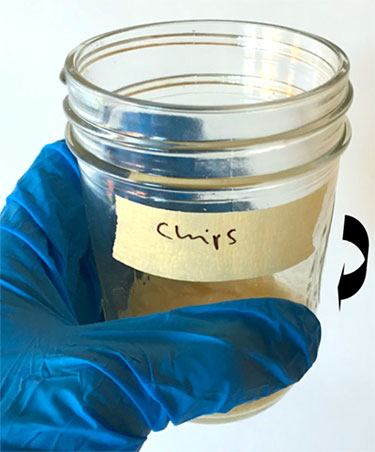
- Swirl the jar with the acetone and potato chips for 2 minutes. Remember to do this step in a well-ventilated area. Swirling will help the fats dissolve in the acetone.
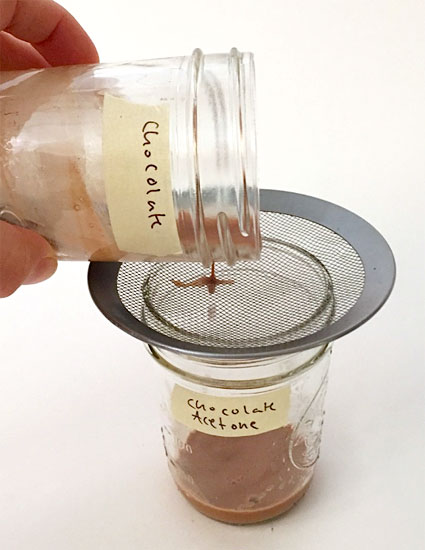
- After 2 minutes of swirling, let the food settle for a moment and then carefully pour the acetone into one of the jars that is labeled potato chips acetone. Carefully pour the acetone through the fine-meshed strainer to prevent your food from falling into the acetone jar, as shown with the chocolate sample in Figure 4. The acetone should now contain the dissolved fats.
/-/https/www.sciencebuddies.org/cdn/Files/7755/10/decanting-acetone.jpg)
Figure 4. After swirling the food with acetone, carefully pour the acetone through a fine-meshed strainer into the corresponding Mason jar.
- Put all the potato chips that were caught by the strainer back into the potato chips jar. Make sure you do not lose any chips during the transfer.
- Repeat the fat extraction for the soggy, leftover potato chips (still the same trial) one more time with 20 mL of acetone, starting with step 2.
- Continue with the fat extraction of your next set of potato chips samples (trial #2 or #3) and perform steps 2–6 on this sample.
- Once you have finished the fat-extraction process for all three potato chip trials, repeat the extraction procedure (steps 2–7) with the three crushed chocolate samples and the three almond samples.
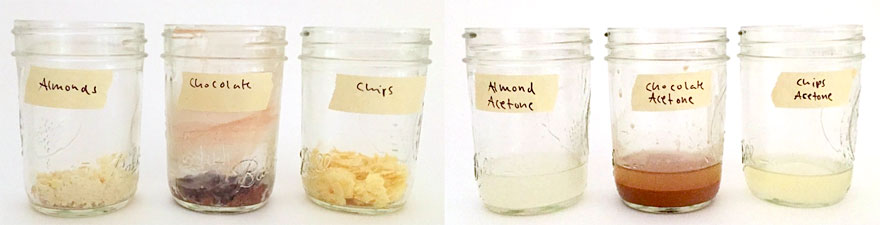
- After completing the extraction for all the crushed foods, put all the Mason jars outside in a safe spot and let them sit there overnight. Do not put the lids back on the jars, as shown in Figure 5, so the acetone can evaporate and will leave behind the fats that you extracted. Make sure that the jars are protected from rain and put them in a box so they will not easily get knocked over. To protect your jars from wildlife, you can cover the whole box or each individual jar with cheesecloth or another small meshed netting. Important: Be sure children and pets are kept away from the open jars at all times!
/-/https/www.sciencebuddies.org/cdn/Files/7756/10/all-jars-after-extraction.jpg)
Figure 5. After the extraction, put all your jars outside in a safe spot to let the acetone evaporate. This picture shows jars from one trial.
- After about 24 hours, carefully inspect the jars to see if the acetone has fully evaporated. A good way to verify that no acetone (or solvent) is left, is smelling into the jars. If you can still smell the acetone, let the jars sit outside for longer until you cannot recognize an acetone smell anymore.
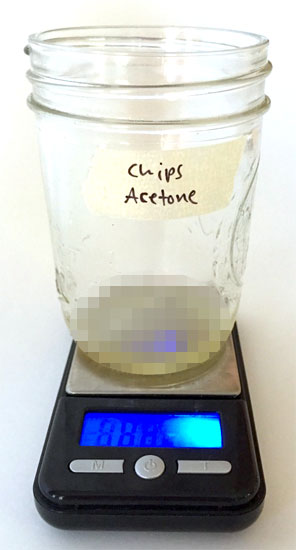
- Once all the acetone has evaporated, use the digital scale to weigh each of the jars and write down each mass in your data table.
- Let the jars adjust to room temperature and look closely at the extracted fats. Also, touch the fats with your fingers to assess texture and consistency (no need to wear gloves for this step as the acetone should have completely evaporated at this point). Make a table, like Table 2, in your lab notebook, in which you report your observations. In the viscosity column, write down if the fat is a (thick or thin) liquid or a (hard or soft) solid. In the texture column, note down if the fat is oily, sticky, waxy, soft, etcetera. You might find that some of your samples are a mixture of solid and liquid fats. In the last column of your table, write down an estimate of how much (in percent) of the total fat in your jar is liquid.
| Food | Trial # | Color | Texture | Odor | Viscosity | Percentage of liquid fat |
|---|---|---|---|---|---|---|
| Potato chips | 1 | |||||
| 2 | ||||||
| 3 | ||||||
| Chocolate | 1 | |||||
| 2 | ||||||
| 3 | ||||||
| Almonds | 1 | |||||
| 2 | ||||||
| 3 |
Table 2. Table in which to record the characteristics of the extracted fats.
Analyzing Your Data
- Take the data table in which you recorded the mass of your jars throughout the experiment and calculate the actual mass of crushed food that you used for the extraction. You get this number by subtracting the mass of the jar with crushed food before extraction from the mass of the empty jar. Write down your results in the data table.
- Next, calculate the mass difference for each jar before and after the extraction and note down the numbers in your data table. Make sure that all your acetone has evaporated, otherwise you will get a wrong result. The mass difference will tell you how much fat was extracted from each food in each separate trial.
- Calculate the fat percentage that you extracted for each food and each trial. To do this, divide the mass difference before and after extraction by the mass of the crushed food and multiply this number by 100. Write down your results in the data table. Note: You can calculate the extracted fat percentage two ways:
- Use the calculated mass difference of the crushed food before and after extraction.
- Use the mass of the extracted fats after the acetone evaporation.
- Look at the nutrition labels of all your foods. For each food, you should find information about how much fat it contains in grams per serving. From this information, calculate the fat percentage for each food and write it down in your data table. Compare these values with the fat percentage you extracted in this experiment. Do they match up? Why do you think these numbers differ and how do you think you can improve your extraction results?
- Calculate the extraction efficiency for each food and trial, which is the percentage of extracted fat compared to the actual amount of fat given on the nutrition label. For this, you have to divide the extracted fat percentage by the actual fat percentage and multiply it by 100.
- As you did three separate trials for each food, you can now calculate the average fat percentage and extraction efficiency for each food. To calculate these, add the fat percentage or the extraction efficiency for each trial of one food and divide it by three (as you had three replicates). Write the results down in your lab notebook. Advanced students can also calculate the standard deviations of their data and add these to their graphs.
- Graph your fat content results in a bar graph with the food type (potato chips, chocolate, and almonds) on the x-axis, and the average percentage of extracted fat for each food on the y-axis. On the y-axis, also include the fat percentages given on the nutrition labels in your graph for comparison.
- In a separate bar graph, plot the extraction efficiency for each food. On the x-axis, show the food type again, but this time graph the average extraction efficiency on the y-axis. Were you able to extract all the fat in your food (100 % extraction efficiency)? If not, why do you think this is the case and how could the extraction efficiency be improved?
- From your observations listed in Table 2, can you tell which food contains saturated and/or unsaturated fats? Look at the Introduction again if you need help with this question.
- Look at the nutrition labels of your different foods again and see if they list the amounts of unsaturated versus saturated fats. Once you find these numbers, calculate the percentage of unsaturated versus saturated fat in the total fat amount of your food. If only one fat type is listed on the nutrition label, assume that the difference to the total fat content represents the other fat type. Calculate the average percentage of liquid fats that you observed in your food from Table 2. Compare these percentages to the calculated percentage from the nutrition labels, assuming that the percentage of liquid fat in Table 2 represents the percentage of unsaturated fat in your food. Do your results agree with the nutrition labels? Was one fat type extracted more easily than the other?
- Make another bar graph showing the amount of unsaturated versus saturated fats in your foods. On the x-axis, show the food type, and on the y-axis plot the average percentage of unsaturated and saturated fats from your results, as well as the data from the nutrition label information. Which food has the highest amount of saturated fats? Did you expect these results? Based on all the results that you got and your knowledge of the effect of different types of fats on health, what are your hypotheses about the healthiness of each of your tested foods?
Ask an Expert
Global Goals
The United Nations Sustainable Development Goals (UNSDGs) are a blueprint to achieve a better and more sustainable future for all.
/-/https/www.sciencebuddies.org/cdn/Files/19746/5/E-WEB-Goal-03.png)
Variations
- What about other foods? Potato chips, chocolate, and almonds are not the only foods that contain a lot of invisible fats. Repeat this experiment, but this time choose a different variety of foods. When you go shopping for foods, you probably notice that you can buy lots of "reduced fat" variants of certain foods, such as potato chips and others. Try to extract fats from the "regular" and the "reduced fat" version of the same food and test if it really contains less fat.
- When extracting fats, it is important to use the right solvent. As explained in the Introduction, acetone is a good candidate because fat easily dissolves in it. But can you also use different solvents? What about ethanol, isopropyl alcohol, or water? Do some research on other potential solvents and repeat this experiment, but replace acetone with a different solvent. When you do so, make sure to follow all health and safety guidelines for this new solvent. Do you get very different results? What are the criteria for a good fat extraction solvent? How do the extraction efficiencies compare? Which one works best?
- You probably noticed in your experiment that the extraction efficiency was below 100 %, meaning that you were not able to extract all the fat contained in the food. Think about ways to increase the extraction efficiency. Does modifying the extraction procedure change how much fat you extract? What happens if you increase the extraction time and swirl the food longer with the solvent, or if you add more extraction cycles? Compare different extraction procedures and find out if you can improve the extraction efficiency.
Careers
If you like this project, you might enjoy exploring these related careers:
/-/https/careerdiscovery.sciencebuddies.org/cdn/Files/1316/17/unsplash-ePJQise0OkQ.jpg)
/-/https/careerdiscovery.sciencebuddies.org/cdn/Files/1309/18/unsplash-vGA1ei1yxos.jpg)
/-/https/careerdiscovery.sciencebuddies.org/cdn/Files/1203/17/iStock-1210522370.jpg)
/-/https/careerdiscovery.sciencebuddies.org/cdn/Files/1107/19/pexels-photo-3938023.jpg)

/-/https/img.youtube.com/vi/To3DKP99-1U/0.jpg)
/-/https/img.youtube.com/vi/yEciiScv3Gw/0.jpg)
/-/https/img.youtube.com/vi/FfrFYW4TDQQ/0.jpg)