Abstract
What is cancer? How does it develop? Doctors and scientists have asked these questions for hundreds of years to understand cancer and find treatments. In this science project, you can investigate these questions too by building a simple model and exploring how environmental and genetic changes affect the development of cancer.
Summary
Basic knowledge about what DNA mutations are.
Readily available
No issues
/-/https/www.sciencebuddies.org/cdn/Files/19933/9/cancer-disease-modeling-progression-thumb.jpg)
Objective
Build a simple cancer model to investigate how the chances of developing cancer change depending on environmental and genetic factors.
Introduction
/-/https/www.sciencebuddies.org/cdn/Files/19933/9/cancer-disease-modeling-progression-thumb.jpg)
Cancer has impacted humans for many generations. Scientists and doctors have spent their lives trying to understand what cancer is and find new ways to treat and prevent it. The earliest records of cancer date back to descriptions of tumors from an ancient Egyptian textbook on surgery where it was stated, "There is no treatment." However, new immunotherapy treatments hold promise for cancer treatment.
Our understanding of cancer and our ability to treat it has evolved greatly since ancient times. Today, we know that cancer is cells' unregulated division and growth due to changes in the deoxyribonucleic acid (DNA). DNA is the instructions for making a cell. Let's break down what that means. Even under normal, healthy conditions, the cells in our bodies are constantly growing and dividing to replace older cells. Each cell division takes place from a parent cell that divides into two identical daughter cells in a process of cell division called mitosis. This process takes place often, in fact, we replace approximately 330 billion cells per day!
Despite the high number of cell divisions, the process for each division is highly regulated by the cell cycle. The cell cycle provides checks and balances to ensure that cells divide only when they get the right signals to do so and that the DNA in the cell is copied and packaged correctly during division. Mistakes are often noticed during cell division, and the problematic cells are carefully killed off in a process known as apoptosis. If a mis-divided cell escapes apoptosis, it is often noticed by the immune system and destroyed.
Despite all these checks and balances, things occasionally go wrong, and a cell with a mutation (change in its DNA) escapes both apoptosis and the immune system. Everyone has cells in their body with mutations, but with aging, the immune system gets less effective at flagging these cells for apoptosis. Therefore, the older you are, the more mutated cells you are likely to have, which can become cancerous.
Some mutations do not matter because they do not change a gene's function. However, some mutations do become problematic, particularly in genes associated with cancer, such as oncogenes (cancerous genes) and tumor suppressor genes. As more cell divisions occur, more mutations can accumulate, and the chances of a mutation impacting one of these cancerous genes are higher. Additional gene mutations that control how the cell divides and grows can lead to the cells growing uncontrollably. This uncontrolled growth of mutated cells is what we call cancer.
/-/https/i.ytimg.com/vi/R4rxlRsNcs8/hqdefault.jpg)
To understand in detail how diseases like cancer develop and explore treatment options, scientists and doctors create mathematical disease models. A disease model aims to represent what is happening in the patient population and can continually be updated based on new research findings. There are four steps to mathematical disease modeling:
- Build the model from existing data. That data could be from real-world observations, data from experiments, or a combination of both. The model describes what scientists and doctors think happens with the disease on a biological level.
- Validate the model. The model is tested to see if it makes sense. If the model outputs results that match up with what we observe about the disease in the real world, then the model is considered valid (representative of the truth). If not, the model is revised until it matches the real-world observations.
- Use the model. The model is used to make predictions or run experiments related to the disease, its spread, and/or how to treat it.
- Revise or retire the model. As new observations and data are gathered, the model may need to be revised or retired altogether in favor of a new model.
In this science project, you will build a simple model of how cancer develops using data from published scientific papers and basic arithmetic (addition, subtraction, multiplication, and division). You will use the model to compare how many cell cycles of mutated cells it takes for cancer to develop with and without additional genetic and environmental factors. Then, you will compare the information from your simple model with real-world data to see if your model represents what occurs in everyday life.
Terms and Concepts
- Cancer
- Immunotherapy
- Deoxyribonucleic acid (DNA)
- Cell cycle
- Apoptosis
- Mutation
- Gene
- Oncogene
- Tumor suppressor gene
- Mathematical disease model
- Model validation
- Mutation threshold
Questions
- What is the cell cycle?
- What happens to a cell if it fails to go through the cell cycle properly?
- What do scientists think causes cancer?
Bibliography
Genes, Environment, and Cancer
- HHMI Staff. (n.d.) The Eukaryotic Cell Cycle and Cancer. HHMI Biointeractive. Retrieved September 7, 2023.
- Cancer.Net Editorial Board. (2022, November). Genes and Cancer. American Society of Clinical Oncology. Retrieved September 7, 2023.
- NCI. (2021, March 5). Age of Cancer Risk. Retrieved August, 27, 2024.
Disease Modeling of Cancer
- University of Washington Perspectives. (2021, August 12). Treating Cancer Through Math. Retrieved September 7, 2023.
- Michigan Minds Special Series: Women in STEM. (2021, February 10). Developing Data-Driven Mathematical Models to Study Cancer. University of Michigan Public Engagement & Impact. Retrieved September 7, 2023.
- Uchinomiya, C., et al. (2023, July 14). A mathematical model for cancer risk and accumulation of mutations caused by replication errors and external factors. Retrieved August, 27, 2024.
Materials and Equipment
- Computer with an internet connection
- Lab notebook
Experimental Procedure
Experimental Background: Using Scratch and Scientific Data to Model Cancer
In this experiment, you will build your cancer disease model using a simple programming language called Scratch. To keep track of your experiment, you can easily create a free Scratch account.
If you have never used Scratch before, here are some resources to help get you started:
- Scratch programming tutorials to learn how to use it
- Getting Started with Scratch reference guide
To create a basic cancer disease model, the factors that cause cancer need to be represented. From previous research, we know that when the parent cell divides, the daughter cell can accumulate mutations (Figure 1). In each cell division, more mutations can accumulate in each new daughter cell until there are finally enough mutations that a cancer cell develops. It takes many cell divisions to get a cancer cell.
/-/https/www.sciencebuddies.org/cdn/Files/19934/10/cancer-cell-lineage.jpg)
Figure 1. Cancer comes from the accumulation of random mutations over many cell divisions.
/-/https/www.sciencebuddies.org/cdn/Files/19935/10/cancer-cell-cyle.jpg)
Figure 2. This diagram shows how cells can avoid cell death mechanisms and accumulate mutations through multiple cell divisions to become cancerous.
Now that we have outlined what our model does and the data we need to plug into it, we can look into the literature to see if that data exists and use that information to choose our variable thresholds. We have provided references for you and shared the references for you to check and find the key data for each threshold in Table 1. We have also added information on how to use the data to make data-informed threshold choices. Additional research is necessary to build a more complex model. The variations offer some suggestions for this.
| Variable | Definition | Reference | Making Data-informed Threshold Choice | Key Data for Threshold Choice |
|---|---|---|---|---|
|
Mutation Rate |
The rate at which daughter cells accumulate mutations every cell division for normal cells (human somatic, diploid cells). |
Lee-Six, H., et al. (2018, September 5). Population dynamics of normal human blood inferred from somatic mutations. Retrieved August 27, 2024.
|
Choose the number of mutations in the genome per every cell division. | |
|
Cancer Mutation Threshold |
The number of mutations a daughter cell must accumulate to become a cancer cell. |
Martincorena I., et al.(2017, November 6). Universal Patterns of Selection in Cancer and Somatic Tissues. Retrieved August 27, 2024.
|
When developing a disease model, thresholds are typically the top or cut-off of a range. This is the case for this variable because the higher the number of mutations, the more likely a cell will become cancerous, so choose the maximum number in this range as the threshold. |
|
|
Cell death |
The chance of a mutated daughter cell escapes cell death or apoptosis or evades the immune system. |
Zhang, W., et al. (2024, March 7) Pan-cancer evaluation of regulated cell death to predict overall survival and immune checkpoint inhibitor response. Retrieved August 27, 2024.
|
Cancer cells can avoid cell death in multiple ways. In this model, assume that mutated cells will escape a very small proportion of the time. Choose the minimum percentage from the range presented for the related cell death (RCD) and round down to the nearest whole number. |
|
| Smoking | The mutation rate due to smoking cigarettes. |
Klein, A. (2016, November 3). Every 50 cigarettes smoked cause one DNA mutation per lung cell. Retrieved August, 27, 2024.
|
Choose the number of mutations per lung cell per every 50 cigarettes (2.5 packs per day) | |
| BRCA1 or BRCA2 mutation | The mutation rate is due to an inherited mutation (pathogenic variant) in the BRCA1 or BRCA2 gene. |
Zámborszky, J. et al. (2016, July 25). Loss of BRCA1 or BRCA2 markedly increases the rate of base substitution mutagenesis and has distinct effects on genomic deletions. Retrieved August 27, 2024.
|
Choose the number of times the mutation rate in breast tissue is higher when the BRAC1 or BRCA2 gene mutation is present. |
Table 1. Primary research data you will use to build a simplified mathematical disease model of cancer.
Building a Cancer Disease Model
Now that we've researched thresholds for mutation rates and apoptosis evasion, you are ready to start building your cancer model. The following steps can be used to write the starting model yourself. Alternatively, you can use the premade Science Buddies Scratch Project program and learn about modifying the disease model with additional risk factors below.
- To create the project from the bottom up, open Scratch.
- Select "Create" at the top of the screen to create a new project.
- Select the variables tab to create new variables.
- Select the "Make a Variable" box.
- Type the new variable names in the pop-up window that says "New Variable." The variable names are:
- Mutation Rate
- Cancer Mutation Threshold
- Total Number of Mutations: How many mutations are in the DNA of the cells in your model.
- Number of Cell Cycles: How many cell cycles have passed before a cancer cell appears.
- Cell death
- Select ok to add the variable to the checklist, like in Figure 3.
/-/https/www.sciencebuddies.org/cdn/Files/19936/10/cancer-disease-modeling-variables.png)
Figure 3. Scratch blocks for the five variables needed to build the starting model.
- Select the "Events" tab.
- Drag and drop the "when the green flag is clicked" icon to the main screen.
- Select the "Variables" tab.
- Select your variable from the drop-down menu in the set variable function.
- Drag and drop each pre-set variable to the program. Place and attach them under the "when the green flag is clicked" icon, like Figure 4.
- Based on the data collected in Table 1, set the starting values for each of the 5 variables to their threshold rates.
- The remaining thresholds of the variables not shown in Table 1 should be set to zero.
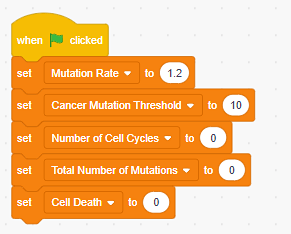 Figure 4. Scratch code showing the starting values of the variables based on research findings in Table 1.
- Create a separate program for what happens during a single-cell division. Figure 5 shows one possible solution.
- Select the change function to increase the Number of Cell Cycles by one after each cell division.
- Select the Number of Cell Cycles variable in the drop-down menu with the change text out front.
- Double-check to make sure the change number is by increments of 1.
- Select the change function to increase the Total Number of Mutations in the daughter cell by the Mutation Rate.
- Select the Total Number of Mutations variable in the drop-down menu with the change text out front. Drag and drop it under the previously changed variable.
- Then, drag and drop the Mutation Rate variable over the number box to insert the variable.
- Add a statement to indicate whether the cell survives or if there is Cell Death.
- Select and set the Cell Death variable under the previous variables. Drag and drop it under the previously changed variable.
- Go to the operator tab, select the pick random command with two number boxes, and drag and drop it over the number box to create a range.
- Change the cell death range to reflect the chance of escaping cell death (0.1%) to the range from 0.000 to 1.000 for the Cell Death variable.
- Add an if-then statement to indicate what happens when a daughter cell escapes Cell Death.
- Go to the control tab to select an if, then statement. Drag, drop, and attach it under the previous variable.
- Go to the operator's tab and select a greater than statement
- Add the Cell Death variable on the left of the greater than symbol.
- Update the threshold to 0.001. The daughter cells' chance of escaping Cell Death is low (>0.001). Therefore, if the value is greater than 0.001, the daughter cell will die.
- Add a change statement with the Total Number of Mutations variable to the insert of the then statement. If the daughter cell dies, this will decrease the Total Number of Mutations variable.
- Go to the operator tab and add a multiplication operator to the number box.
- Update the number box in the change statement to -1 multiplied by the Mutation Rate since a decrease in this variable indicates that there are fewer of the Total Number of Mutations since the daughter cell died, but the mutated parental cell remains.
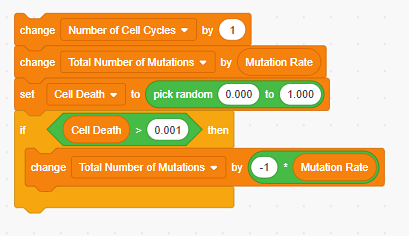 Figure 5. Scratch code for what should happen during a single cell cycle.
 - Select the change function to increase the Number of Cell Cycles by one after each cell division.
- Now that we have the code for a single cell division, we need to add code to make the cancer model continuously repeat cell cycles until the conditions for cancer are met. One possible solution is shown in Figure 6.
- To create a repeating loop to model what happens to mutated cancer cells over time:
- Select the control tab. Drag and drop the repeat until control under your wait 1-second function.
- Go to the operator tab. Drag and drop the greater than operator into the hexagon of the repeat until function.
- Add the Total Number of Mutations variable to the left number box.
- Drag and drop the Cancer Mutation Threshold variable to the right number box.
- Move the second set of programs representing a single cell cycle from Figure 5 into the repeat until function to represent multiple cell cycles.
- Optional: You can also add graphics to make the program visually appealing and clear to users when the model is finished running. To do this, go to the Looks tab and insert the switch costume to function before and after the program, like in the example model.
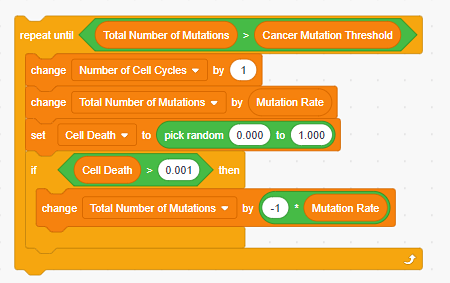 Figure 6. The scratch code for a single cell cycle will be repeated until the cancer mutation threshold is met.
- Optional: You can also add graphics to make the program visually appealing and clear to users when the model is finished running. To do this, go to the Looks tab and insert the switch costume to function before and after the program, like in the example model.
- To create a repeating loop to model what happens to mutated cancer cells over time:
- Add a wait 1-second control function between the single cancer cell variable thresholds (Figure 4) and the repeating cell cycles step (Figure 6).
- Run your model at least ten times. Each time, record in your lab notebook how many cell cycles (Number of Cell Cycles) it takes for a cancer to appear. You can also run the model integrated into the webpage here:
/-/https/www.sciencebuddies.org/cdn/Files/19937/10/cancer-modeling-set-variables.png)
/-/https/www.sciencebuddies.org/cdn/Files/19939/10/cancer-disease-modeling-cell-cycle.png)
/-/https/www.sciencebuddies.org/cdn/Files/19938/10/cancer-disease-modeling-code.png)
Modifying the Cancer Disease Model
- Once you have your starting cancer disease model built, you are ready to modify it to see what happens to the chances of developing cancer due to aging with additional specific environmental and genetic factors. Keep in mind that your original cancer model still contributes to the risk of cancer because all humans age. However, additional environmental and genetic factors can increase or decrease your risk.
- Environmental Factor:
- Smoking cigarettes is an environmental factor that changes a person's chances of getting lung cancer. Use Table 1 for information about how smoking affects the mutation rate of cells. Use this information to modify your cancer disease model to include the impact of smoking a pack of cigarettes a day.
- Example: If the mutation rate for smoking a specific number of cigarettes is 2 per cell for every 50 cigarettes (2.5 packs), and the average number of cigarettes smoked per day is 1 pack, then divide the number of mutations by the number of packs per day, like this: 2/2.5 = 0.8. This will give you the average number of mutations per cigarette pack per day. Then, add that to the previous mutation rate like this: 1.2 + 0.8 = 2.
- Based on your own calculations, update the Mutation Rate variable.
- Run your model at least ten times for people who smoke 1 pack a day.
- Record each trial in your lab notebook, similar to Table 2, to keep track of the Number of Cell Cycles it takes for a cancer cell to appear.
- Smoking cigarettes is an environmental factor that changes a person's chances of getting lung cancer. Use Table 1 for information about how smoking affects the mutation rate of cells. Use this information to modify your cancer disease model to include the impact of smoking a pack of cigarettes a day.
- Genetic Factor:
- Some families with a history of breast cancer have mutations that change the function of the BRCA1 or BRCA2 genes. Using the information in Table 1, modify your starting cancer disease model to see what happens to the chances of getting breast cancer with a BRCA1 or BRCA2 mutation.
- Example: If the mutation rate is five times higher than the normal rate, then you will need to multiply the previous mutation rate from the original model by five, so 1.2 x 5 = 6.
- Based on your own calculations, update the Mutation Rate variable.
- Run your model at least ten times for people with BRCA1 or BRCA2 mutations.
- Record each trial in your lab notebook, similar to Table 2, to keep track of the number of cell cycles it takes to create a cancerous cell.
- Some families with a history of breast cancer have mutations that change the function of the BRCA1 or BRCA2 genes. Using the information in Table 1, modify your starting cancer disease model to see what happens to the chances of getting breast cancer with a BRCA1 or BRCA2 mutation.
- Compare your results for the three cancer disease models you built (cancer model, cancer model + smoking, and cancer model + genetic mutation in BRCA1 or BRCA2).
- What is the range of the Number of Cell Cycles for each model? Remember, the range is the minimum and maximum number.
- What is the average Number of Cell Cycles (of the 10 trials) before cancer appears in each model?
- Calculate the years it will take for the cell to become cancerous. To do this, use the primary literature to inform your calculation that, on average, the cell cycle takes 1 full day to complete.
- Example: If the Number of Cell Cycles = 9426 cycles / 365 cell cycles per year = 26 years
- Note: Depending on the cell type, this may take more or less time; we are oversimplifying here to be able to make comparisons. To make more specific and realistic comparisons, check out the variations!
- Example: If the Number of Cell Cycles = 9426 cycles / 365 cell cycles per year = 26 years
- According to the NCI, the average age of cancer diagnosis is 66. However, the increased rate of mutated daughter cells that escape apoptosis and the immune system takes place approximately 25 years before this! Add the years until the cells become cancerous to 40 to get the predicted age of diagnosis for each model.
-
- Example: If the number of years until the cell becomes cancerous is 9.8, add 9.8 years + 40 years to get a predicted age of diagnosis of 49.8 years.
- Example: If the number of years until the cell becomes cancerous is 9.8, add 9.8 years + 40 years to get a predicted age of diagnosis of 49.8 years.
-
| Model | Number of Cell Cycles | Range of Number of Cell Cycles | Average Number of Cell Cycles | Years Until the Cell Becomes Cancerous | Predicated Age of Diagnosis (years) |
|---|---|---|---|---|---|
| Cancer model |
1. 2. 3. 4. 5. 6. 7. 8. 9. 10. |
||||
| Cancer model + smoking | ... | ||||
| Cancer model + Genetic mutation (BRCA1 or BRCA2) |
Table 2. Example data table for comparing the results of three cancer disease models.
Validating Your Model
- Use the references in Table 3 and any additional resources to find the average age of cancer diagnosis due to aging, smoking, and BRAC1 or BRAC2 status from real-world data. Fill in your research findings in Table 3.
- Then, compare your model's results to see if they are valid (make sense) compared to the real-world data.
- Compare your original model to the average age of diagnosis of cancer.
- Compare your models to the average age at which smokers versus non-smokers are diagnosed with lung cancer.
- Compare your models to the average age of incidence of people with breast cancer with and without mutations that change the function of BRCA1 or BRCA2.
- Do your models match the real-world data? Explain why or why not.
- Optional: Check out the Variations section to see how you can keep improving your models.
| Cancer Risk Factor | Age of Diagnosis Reference | Average Age of Diagnosis (real-world data) |
|---|---|---|
| Age impact on cancer risk |
NCI. (2021, March 5) Age and Cancer Risk. Retrieved August 28, 2024.
|
|
| Smoking's impact on lung cancer |
LoPiccolo, J., et al. (2024, January 9). Lung cancer in patients who have never smoked - an emerging disease. Retrieved August 28, 2024.
|
|
| BRCA1 or BRCA2 impact on breast cancer |
NCI Staff. (July 12, 2017). Large Study Verifies Cancer Risk for Women Carrying BRCA1 or BRCA2 Mutations. Retrieved August 27, 2024.
|
Table 3. Primary literature research on the average age of diagnosis due to different cancer risk factors.
Conclusions
- How does the range of Number of Cell Cycles compare to each other in each model? Do they overlap, and what does this mean?
- Which specific risk factors (smoking or BRCA1 or BRCA2) increased the rate at which the cells became cancerous compared to the original model? Put the years until the cell becomes cancerous for each model from least to greatest to better compare them.
- How accurate do you think each of your models is? Are there other variables that are not accounted for in each model based on reading the research articles, such as family history, viral infections, or cumulative risk over a lifetime?
- How could you improve each of your models? Remember, no model is perfect! Check out the variations for some ideas.
Ask an Expert
Global Goals
The United Nations Sustainable Development Goals (UNSDGs) are a blueprint to achieve a better and more sustainable future for all.
/-/https/www.sciencebuddies.org/cdn/Files/19746/5/E-WEB-Goal-03.png)
Variations
There are many ways to make this model more sophisticated. Try one or more of these suggestions:
- How does smoking more or less than 1 pack of cigarettes a day impact the age of diagnosis of cancer? Modify your calculation to account for this change and re-run your model compared to the 1 pack a day results to find out.
- What other modifiable risk factors besides smoking are there that impact cancer risk? Check out this article to learn more and find research article data to incorporate these environmental factors into new models.
- Program your cancer disease model in a different language, like Python, with more capabilities than Scratch. Consider upgrading your model to use a Monte Carlo Simulation. The Monte Carlo Simulation will replace the need to run your model by hand multiple times and will more accurately help you determine the number of cell cycles for each condition (normal, smoking, or BRAC1 or BRCA2 mutations). To get started, watch this video introduction to the Monte Carlo simulation and consult this python tutorial for Monte Carlo simulations.
- Create a more specific model with Python. Do some research to find research articles (like this one) to adjust the cell division time of specific cell types affected by the type of cancer and adjust the models accordingly. How does changing the cell cycle time impact the years until the cell becomes cancerous? Does it make it more specific? How does each compare to the real-world data?
- Different cancers have different gene drivers. Model a single type of cancer and the chances of accumulating mutations in the specific genetic drivers for that cancer. This write-up on genetic drivers of cancer is a good place to start your research.
Careers
If you like this project, you might enjoy exploring these related careers:
/-/https/careerdiscovery.sciencebuddies.org/cdn/Files/1011/20/pexels-photo-7375.jpg)
/-/https/careerdiscovery.sciencebuddies.org/cdn/Files/17070/11/pexels-photo-5716042.jpg)
/-/https/careerdiscovery.sciencebuddies.org/cdn/Files/1442/17/unsplash-TXxiFuQLBKQ.jpg)
/-/https/careerdiscovery.sciencebuddies.org/cdn/Files/1628/18/iStock-1203995945.jpg)
/-/https/careerdiscovery.sciencebuddies.org/cdn/Files/967/17/unsplash-d4KQc-ZqBrc.jpg)

/-/https/img.youtube.com/vi/RXVBU4gTPl0/0.jpg)
/-/https/img.youtube.com/vi/B5N3Q0YGGd8/0.jpg)
/-/https/img.youtube.com/vi/6KttMKX17YE/0.jpg)