Abstract
Have you ever gone to pour yourself a cup of milk and all you get is milk clumps? What happened to the milk is called coagulation, which is the mechanism that occurs when proteins in the milk clump together. While you do not necessarily want this in your milk, without coagulation (or curdling), there would not be any cheese or yogurt, which is why it is a very important process in the food industry. But what makes milk curdle? In this science project you will use pineapple juice to curdle milk and measure the coagulation process, over time, with a self-made turbidity meter.Summary
- Google SheetsTM is a registered trademark of Google, Inc.
- Microsoft® is a registered trademark of Microsoft Corporation.
- Excel® is a registered trademark of Microsoft Corporation.
Recommended Project Supplies
Objective
Measure how milk curdles when adding pineapple juice, with the help of a self-made turbidity meter.
Introduction
Milk is truly a multipurpose liquid. By itself, milk is a healthy and nutrient-rich beverage, but when you start treating milk in various processes, all kinds of other products can be created, such as butter, yogurt, buttermilk, and cheese. Milk mostly consists of fat, protein, lactose, and water. The fat is suspended in milk water as fine droplets or globules, which makes it an emulsion. At the same time, there are a lot of proteins in milk, mostly whey and casein. As casein is poorly soluble in water, casein proteins build spherical structures, called micelles, that allow them to stay in suspension as if they were soluble. But what does this have to do with milk curdling?
With both the fat and the proteins in suspension, the milk is a white liquid as we know it. However, the casein micelle structures can easily be disrupted or changed. And once they are altered, they cannot be reformed. Because the micelle structure is holding the casein protein in suspension, without it, the micelles will aggregate and the casein comes out of solution. The result is a gelatinous material, called curd. The process of casein micelle aggregation is also called milk coagulation, or curdling, and is shown in Figure 1.
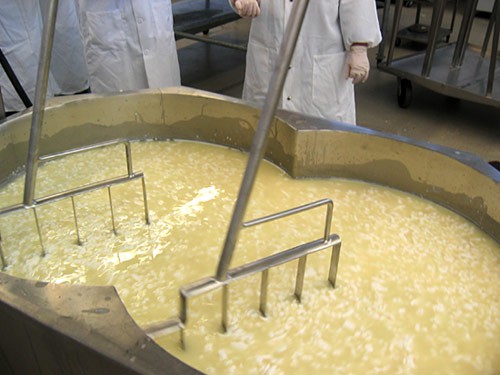
Figure 1. Milk coagulation happens when the milk proteins (caseins) clump together. Curdling milk is the first step in cheese production.
(Image by James.folsom at English Wikipedia, via Wikimedia Commons)
Curdling of milk is the starting process for many other dairy products, such as cottage cheese, ricotta, paneer, or cream cheese. This is why in cheese production, people want the milk to curdle. There are different ways of inducing milk coagulation. You can do it with either acid or with heat, by letting the milk age long enough, or with specific enzymes. Enzymes are proteins that are very specific for a certain chemical reaction. Chymosin, for example, is an enzyme that is derived from rennet and is used for milk coagulation as it specifically alters the casein micelle structure so the milk starts to curdle. Proteases are other enzymes that are able to make milk curdle as they are chopping up other proteins and disrupt the casein micelle structure this way. In this science project, you will use fresh pineapple juice to curdle milk. The pineapple contains another enzyme, called bromelain, which is a protease enzyme and works very well for milk curdling. You will see for yourself in this science project!
One way to monitor your curdling process is by looking at the milk's turbidity. If light is shone through milk, the light beam will bounce of the tiny fat droplets and the casein micelles that are suspended in milk and will be redirected or scattered. This is the reason why milk appears white and is not clear. During curdling, the milk will lose its white color as the casein will fall out of suspension. To assess the milks turbidity, this scattered light can be measured at a 90° angle from the direction of the incoming light. A device that can do that is called a turbidimeter. You will build your own simplified turbidimeter for this science project, as shown in Figure 2.
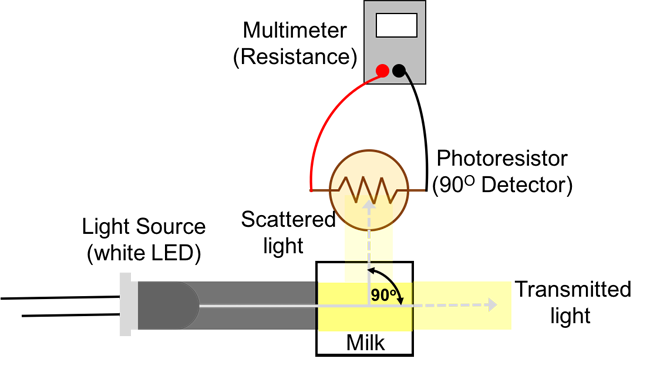 Image Credit: Svenja Lohner, Science Buddies / Science Buddies
Figure 2. Explanation and setup (not to-scale) of your self-made turbidimeter. Some of the incoming light from the white LED is scattered by the fat droplets and casein micelles in the milk, and is then detected by the detector (photoresistor) at an angle of 90° from the initial path of the light beam. The remaining light is transmitted through the liquid and emerges on the opposite side.
Your turbidimeter will consist of a circuit that has a light source (a white light-emitting diode (LED)) and a light detector (a photoresistor). Your milk solution will then be placed between the light source and the detector and your measurement output will be the level of resistance from your detector, measured in ohms (Ω). The photoresistor has a high resistance in the dark, and its resistance decreases as light levels increase. As more light is scattered by your sample, more light reaches the detector, so the resistance decreases. How clear do you think your milk will get when adding fresh pineapple juice?
Terms and Concepts
- Milk
- Emulsion
- Whey
- Casein
- Micelle
- Aggregate
- Curd
- Coagulation
- Enzyme
- Chymosin
- Protease
- Bromelain
- Turbidity
- Light scattering
- Turbidimeter
- Light-emitting-diode (LED)
- Photoresistor
- Resistance, ohm (Ω)
Questions
- What are the different components in milk?
- What is the scientific definition of the word turbidity?
- How does particle size and the wavelength of light affect light scattering?
- Is there a linear relationship between particle concentration and intensity of scattered light?
- During what processes is milk curdling used in the food industry?
Bibliography
- Wikipedia. (2016). Curdling. Wikipedia: The Free Encyclopedia. Retrieved June 8, 2016.
- Cheese Science Toolkit. (2016). Milk Chemistry. Retrieved June 8, 2016.
- Food-Info. (2014). Milk Proteins. Retrieved June 8, 2016.
- Omega Engineering. (2008). Turbidity Measurement. Retrieved June 8, 2016.
- Science Buddies. (n.d.). How to Use a Breadboard. Retrieved July 20, 2016.
- Science Buddies. (n.d.). How to Use a Multimeter. Retrieved July 20, 2016.
Building Your Turbidity Meter
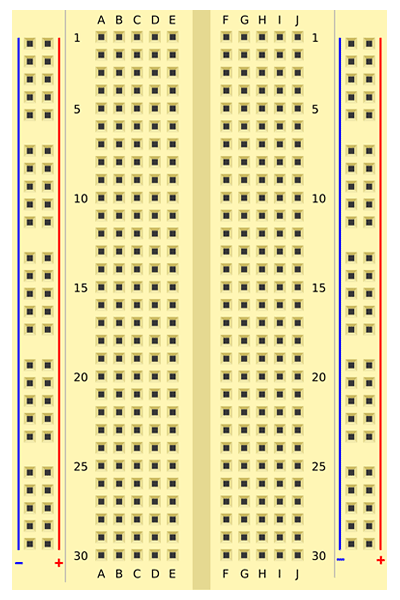
In this section, you will assemble a circuit on a breadboard. If you have never used a breadboard before, you should refer to the Science Buddies resource How to Use a Breadboard for Electronics and Circuits before you proceed. You can follow a step-by-step slideshow that will show you how to put components in the breadboard one at a time. Alternatively, Table 1 lists each component and its location on the breadboard. Important: Read these notes before you proceed.
Materials and Equipment 
Recommended Project Supplies
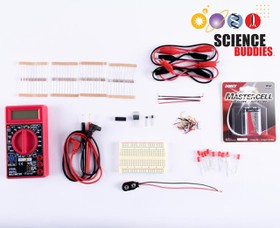
- Electronic Sensors Kit, available from our partner
Home Science Tools.
You will need these items from the kit:
- Solderless breadboard (1)
- Jumper wires (3)
- Alligator clip leads (2)
- 9 V battery (1)
- 9 V battery snap connector (1)
- Photoresistor (1)
- High-brightness white LED (1)
- 220 Ω resistor (1)
- Digital multimeter
- You will also need to gather these items, not included in the kit:
- Piece of dark (black, brown, or dark blue) construction paper
- Small plastic cups, 3 oz (7), available from Amazon.com
- Cuvettes 3.5 mL, ideally clear sides (matte or grooved sides are fine, too) (9), available from Amazon.com
- Clear tap
- Dark or opaque bowl, or a cardboard box, to block all light from the turbidity meter
- Milk, fat-free
- 10 mL graduated cylinder, available from Amazon.com
- Tap water
- Spoon
- Eye dropper or transfer pipettes (9), available from Amazon.com
- Dim light, such as a nightlight or a red LED flashlight
- Fresh or frozen pineapple; do not substitute canned pineapple as it will not work well
- Cheesecloth; any piece of cotton fabric (even an old cotton T-shirt) can be substituted
- Food grater
- Microwave-safe container
- Stopwatch
- Permanent marker
- Lab notebook
Disclaimer: Science Buddies participates in affiliate programs with Home Science Tools, Amazon.com, Carolina Biological, and Jameco Electronics. Proceeds from the affiliate programs help support Science Buddies, a 501(c)(3) public charity, and keep our resources free for everyone. Our top priority is student learning. If you have any comments (positive or negative) related to purchases you've made for science projects from recommendations on our site, please let us know. Write to us at scibuddy@sciencebuddies.org.
Experimental Procedure
- Resistors are marked with colored bands. These colors do matter. Make sure you pick the right resistors for each step according to the markings.
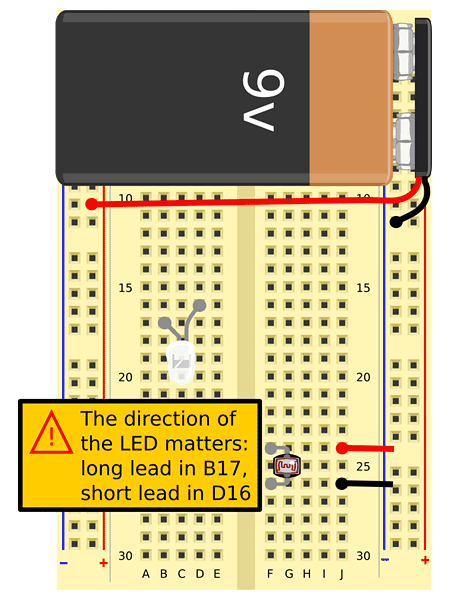
- It matters which direction some of the components are facing. Make sure you read the slideshow captions for any special notes about inserting each part.
- This section only shows you how to assemble the circuit. For a detailed explanation of how the circuit works, see the Help section.
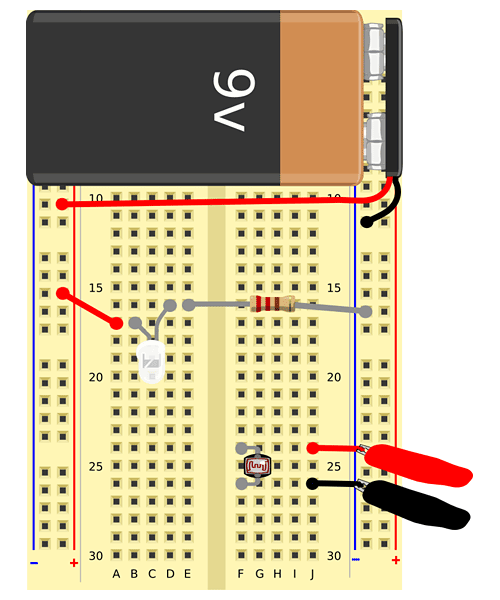


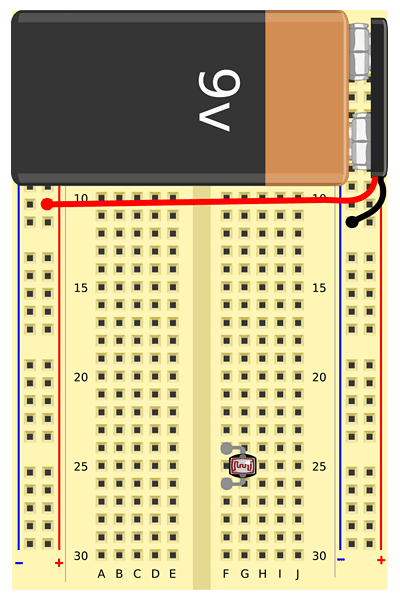
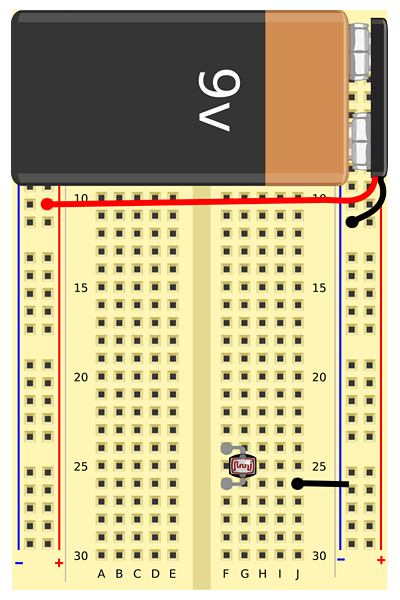
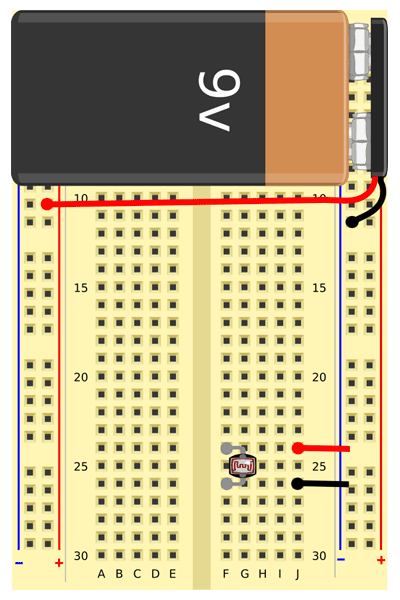

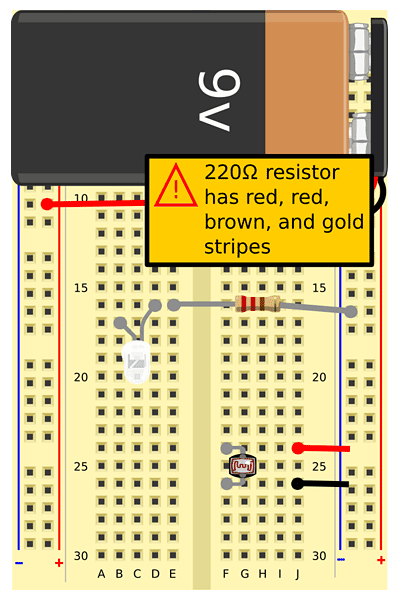
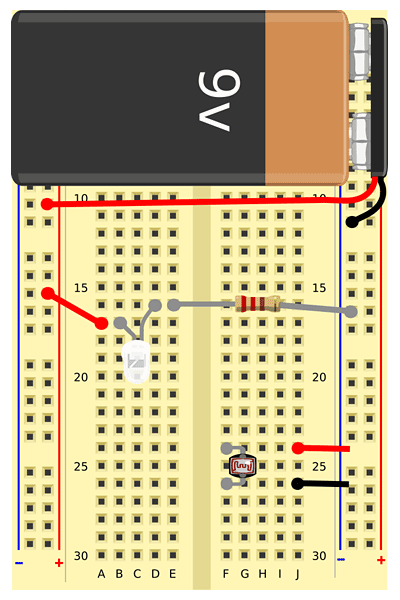 Image Credit: Svenja Lohner, Science Buddies / Science Buddies
Slideshow with step-by-step instructions viewable online.
| Part name | Picture | Breadboard Symbol | Location |
|---|---|---|---|
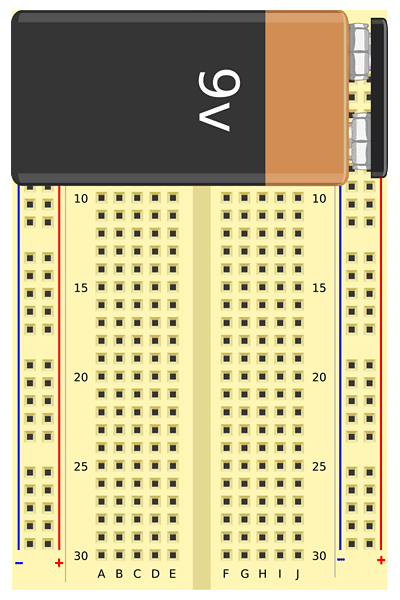
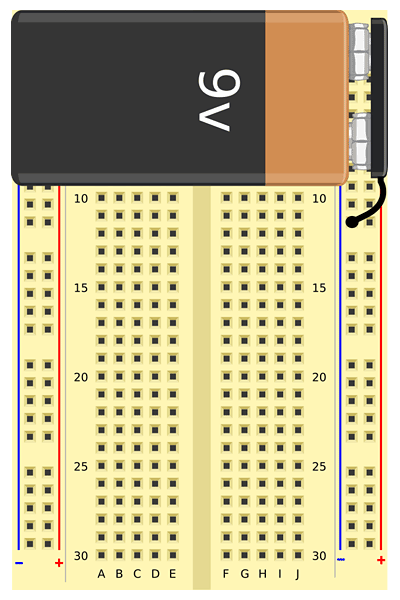
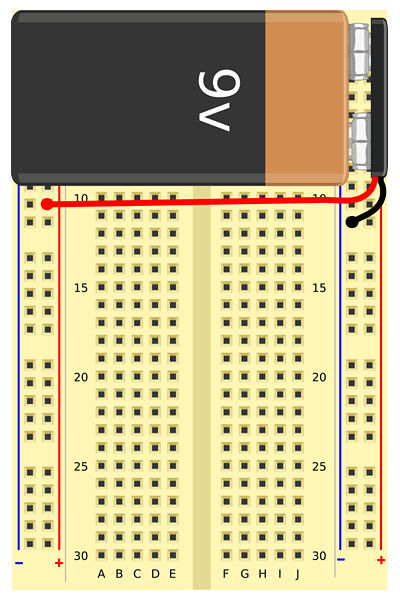
| 9 V battery |  Image Credit Image Credit
|
 Image Credit Image Credit
|
Red wire to (+) bus Black wire to (-) bus |
| Photoresistor | 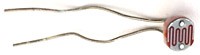 Image Credit: Svenja Lohner, Science Buddies / Science Buddies Image Credit: Svenja Lohner, Science Buddies / Science Buddies
|
 Image Credit Image Credit
|
F24, F26 |
| White LED | 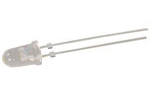 Image Credit Image Credit
|
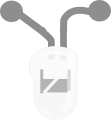 Image Credit Image Credit
|
Long lead to B17 Short lead to D16 |
| Jumper wires (3) | J26 to multimeter J24 to multimeter A17 to (+) bus |
||
| 220 Ω resistor | 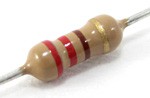 Image Credit Image Credit
|
E16 to (-) bus |
Testing the Turbidity Meter
After you have finished building your circuit, testing the turbidity meter is necessary to ensure that all the electronic components are connected correctly and your device works as expected. Note: Stray light will cause problems and may result in fluctuating data. Perform the readings in a dimly lit room if stray light is a problem and make sure to always place the cuvettes into your device the same way. If the sides of your cuvettes are not all clear, but two of them are grooved or frosted, make sure that the clear side is always facing toward the LED and the frosted or grooved side is facing toward the photoresistor. Place a heavy bowl or cardboard box upside-down over your breadboard during measurement to block out surrounding light. If you get fluctuating data, make sure your cuvettes are free of smears or dirt on the outside and there are no air bubbles sticking to the sides.
- Cut a small piece of dark construction paper and roll it into a tube that just fits on the head of the LED. The tube length should be about 2 cm. Place the tube on the head of the LED and attach it with some tape so it is not able to slide off.
- Place an empty cuvette upside-down over the photoresistor. Make sure that for this cuvette, the clear side faces toward the front of the photoresistor. Bend the photoresistor leads as needed to fit underneath the cuvette. Use tape to hold the cuvette over the photoresistor in place. But do not block the light path!
- The light path from the LED and the tube should be exactly aligned with the height of the photoresistor, as shown in Figure 3. Bend the wires on the LED and photoresistor for adjustment, if needed.
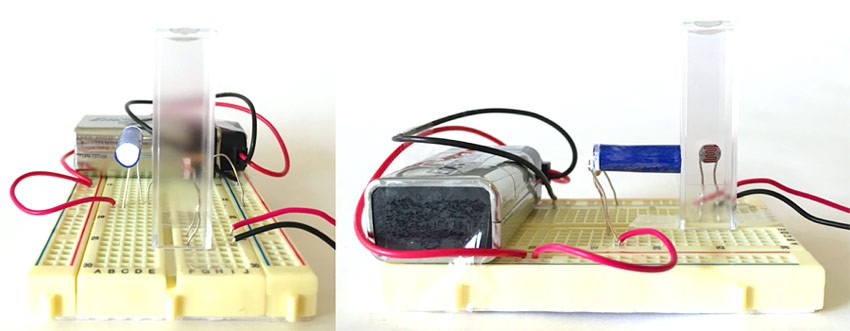 Image Credit: Svenja Lohner, Science Buddies / Science Buddies
Figure 3. The light path of the LED should be directly aligned with the height of the photoresistor.
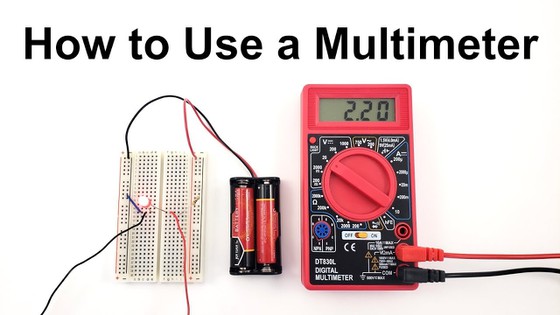
- Set up the multimeter to measure the resistance of the photoresistor.
- Plug the black multimeter probe into the port labeled COM.
- Plug the red multimeter probe into the port labeled VΩmA.
- Turn the dial setting to 200 kΩ.
- Turn the power switch ON.
- Make sure you remembered to use the alligator clips to attach the multimeter probes to the jumper wires connected to the photoresistor coming from J24 and J26.
- As you connected the jumper wire from A17 to the power (+) bus already, your LED should still be turned on.
- Cover the circuit (but not the multimeter) with a dark bowl or a cardboard box to block ambient light.
- Read the resistance across the photoresistor and record it in your lab notebook.
- Note the units of the resistance. A "k" indicates kilo-ohms (kΩ).
- If your multimeter screen displays a "1.", that means the resistance is too high for the dial setting. Turn the dial up to the next highest range (for example, from 200 k to 2000 k) and check again.
- If this is your first time using a multimeter, refer to the Science Buddies resource How to Use a Multimeter, specifically the section How do I measure resistance?, to learn more.
- Remove the bowl and turn off the LED by removing the jumper wire from the power (+) bus.
- Cover the circuit with the bowl again. In the dark, the resistance should be in the mega-ohm range. Remember that you may need to adjust the dial setting to get a measurement. Record the resistance in your lab notebook.
- Remove the bowl and turn off the multimeter to conserve battery power.
Preparing and Measuring Your Test Samples
In this step, you will measure a range of test solutions on your turbidity meter to demonstrate how different amounts of particles or colloids present in a sample result in different light scattering.
- Label six clear small plastic cups 1–6 with the masking tape and permanent marker.
- You will make a series of 1:10 dilutions with the following contents, as shown in Figure 4.:
- Water
- 100 percent fat-free milk
- 1/10 dilution
- 1/100 dilution
- 1/1,000 dilution
- 1/10,000 dilution
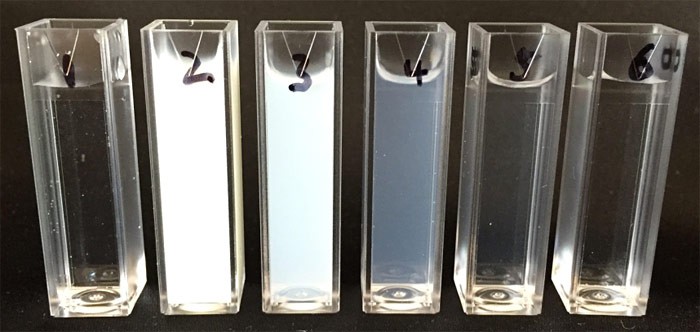 Image Credit: Svenja Lohner, Science Buddies / Science Buddies
Figure 4. Test solutions with different dilutions of fat-free milk.
- Put 10 mL of water in cup #1 and 10 mL of fat-free milk in cup #2.
- Put 9 mL of water into cup #3. Add 1 mL of fat-free milk. Stir with a clean spoon.
- Put 9 mL of water into cup #4. Add 1 mL from cup #3. Stir with a clean spoon.
- Repeat the 10-fold dilutions for cups #5 and #6.
- Transfer the water and all other solutions into six clean and labeled cuvettes. Use an eye dropper or a transfer pipette, or pour carefully. Note: The cuvettes hold approximately 3 mL of solution. Also, make sure to label the cuvettes at the very top so as not to cover the light path with your writing.
- Now you are ready to measure scattered light from each of your test samples. Move the circuit and the cuvettes to a work area with dim light. There should be just enough light for you to work and to read the multimeter. You could use a nightlight or a red LED flashlight as a work light.
- Attach the red and black multimeter probes to the red and black wires in contact with the photoresistor (coming from J24 and J26) using the cables with the alligator clips, if they are not yet connected.
- Set the multimeter to read resistance again. Remember that you might have to adjust the range as you take different readings.
- First, place your blank sample with only water in the corner between the LED and the photoresistor, as shown in Figure 5. Remember to face the clear side of the cuvette with your sample solution toward the LED and the frosted or grooved side toward the photoresistor.
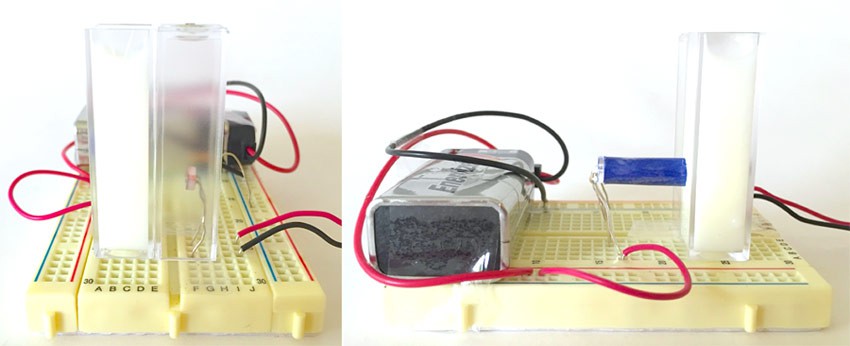 Image Credit: Svenja Lohner, Science Buddies / Science Buddies
Figure 5. Setup of the turbidity meter for measuring your test solutions and milk samples. Note that in these pictures the LED is switched on, but the setup is not covered with a bowl yet.
- Plug in the wire to turn on the LED and cover the breadboard with the bowl. Read the resistance on the multimeter and record the data in your lab notebook.
- Remove the blank cuvette and replace it with the cuvette containing the next solution, starting with the lowest dilution (1/10,000). Cover the breadboard again with the bowl and write down the resistance for this solution. Continue the measurements for each of your five milk solutions.
- Repeat steps 11–13 with the entire set of standards, including the blank, two more times.
- Make a data table in your lab notebook, showing the different dilution levels together with all three recorded resistance measurements for each solution. The resistance should be higher as the solutions get less concentrated.
Tracking Milk Curdling
Now that you have a working turbidity meter, you will use it to track the curdling of milk in the presence of the proteolytic enzyme bromelain from pineapple juice. As bromelain causes the light-scattering particles in the milk to coagulate, the milk becomes more transparent and therefore scatters less light.
- Label three clean cuvettes 1–3 with a permanent marker.
- Make 50 mL of 10 percent milk by adding 5 mL of milk to 45 mL of water.
- Add 3 mL of the 10 percent milk to each cuvette.
- Squeeze 20 mL of fresh pineapple juice into a clean container.
- To get the pineapple juice, take a fresh pineapple, cut off the rind, and grate the flesh. Place the grated fruit in a piece of cheesecloth and squeeze over a clean container.
- Any fresh pineapple fruit will work, as will frozen pineapple that has been thawed at room temperature. Canned pineapple or refrigerated pineapple juice does not work, as they are heat treated and heat destroys enzymes.
- Transfer 10 mL of the juice into a small, microwave-safe container. Microwave the pineapple juice for about 20 seconds, or as long as necessary to get the juice to boil for 3–5 seconds. Heat will destroy enzymes, but will not affect most chemicals. The point is to show that enzymatic activity, which is heat-sensitive, is what causes the milk to clear.
- Place the first cuvette with the 10 percent milk in your turbidity meter with the clear side facing toward the LED and the frosted or grooved side toward the photoresistor. Make sure the device is ready for taking measurements, switching on the LED and setting the multimeter to measure resistance.
- Get your stopwatch ready and add one or two drops of fresh, unheated pineapple juice to the cuvette using an eye dropper or a transfer pipette. Immediately start the stopwatch and record the time at which you added the pineapple juice. Note: You may need to change the amount of juice you add, depending on how fast the reaction occurs under your experimental conditions. Add less pineapple juice to get a slower reaction, and more pineapple juice for a faster one.
- Place the bowl over the turbidity meter to block surrounding light and measure the amount of scattered light by recording the resistance from the multimeter every 2 minutes for 20 minutes.
- Once the 20 minutes are over, remove the cuvette from your turbidity meter and replace it with the second cuvette with 10 percent milk. Repeat the experiment, but this time add the same amount (one or two drops) of the heated, inactive pineapple juice to the cuvette. Again, start the stopwatch once you add the pineapple juice and record the resistance readings every 2 minutes for 20 minutes.
- In the next step, use the third cuvette with 10 percent milk and repeat the experiment with no additions to the milk solution. Make sure to record the resistance readings from the multimeter every 2 minutes for 20 minutes.
- Finally, repeat each experiment (10 percent milk with the addition of fresh pineapple juice, heated pineapple juice, and no additions), following steps 6–10 two more times.
Analyzing Your Data
- Open a spreadsheet and enter your data (the different milk dilutions and the resistance values of these solutions). Calculate the average of your three resistance readings for each test sample.
- Graph the average resistance of your three readings (scattered light) on the y-axis versus the dilution of the milk on the x-axis. You will notice that the relationship between measured intensity of scattered light (or the resistance) and milk concentration is nonlinear. You can linearize the data by performing a base-10 logarithmic transformation of your data. Do not include the water sample in these calculations. Now simply graph the average resistance data on the y-axis versus the log10 of the milk dilutions on the x-axis. You should get a linear curve this time.
- You can add a trend line to the linearized data and display its equation and its correlation factor R2 to show the correlation between light scattering and the milk (or fat droplet and casein micelle) concentration. How does the light scattering (resistance) change when you dilute the milk?
- For each of your test samples (10 percent milk with the addition of fresh pineapple juice, heated pineapple juice, and no additions), enter your resistance data into the spreadsheet and calculate the average of your three readings for each of them.
- Graph the average resistance (scattered light) versus time in minutes for each of your samples. If you want, you can use your milk dilution vs. resistance curve to determine the milk dilution factor before and after coagulation for each of your samples. Remember, that the results from your calculations will be the log(milk dilution factor). To get the real milk dilution factor, you have to convert your result from log(milk dilution factor) to milk dilution factor by taking your calculated result from your curve and raise 10 to that number. How does the pineapple enzyme change the light-scattering behavior of your milk samples? Do you see a difference between your samples treated with fresh versus heat-inactivated pineapple juice?
Troubleshooting
For troubleshooting tips, please read our FAQ: Making Milk Curdle with Pineapple Enzymes.
Ask an Expert
Global Connections
The United Nations Sustainable Development Goals (UNSDGs) are a blueprint to achieve a better and more sustainable future for all.

Variations
- Instead of using bromelain from pineapple juice, experiment with different methods to induce milk coagulation. What happens if you change the pH of your milk by adding lemon juice instead of pineapple juice? Do you find other juices or liquids that are also able to curdle milk?
- Determine how temperature affects the rate of milk clearing by proteases. Use 10 percent milk with active proteases, but heat up or cool down your initial milk sample before you add the pineapple juice. Does the milk curdle faster when it is warm or cold?
- Change the amount of pineapple juice (proteases) added to the milk. How does this change the milk curdling process?
- Instead of measuring the amount of scattered light, measure the amount of absorbed light during the milk coagulation process. For this you have to rearrange the breadboard circuit in a way that the photosensor is placed behind the sample cuvette. You might also have to vary the milk dilution factor of your starting sample. Graph absorbed light vs. resistance. Are the results very different compared to measuring scattered light?
- Measure scattered light in other liquids with suspended particles, such as stomach antacid in water, or water from a local pond. You can also monitor chemical reactions with your self-made turbidity meter. When phosphate (PO43-) and calcium (Ca2+) are mixed in a solution, the insoluble mineral calcium phosphate forms as a white substance that scatters light. Make solutions from antacid tablets (Ca2+) and phosphate-containing fertilizer, and use the sensor to follow the formation of calcium phosphate.
Frequently Asked Questions (FAQ)
 Image Credit: Ben Finio, Science Buddies / Science Buddies
Figure 6. Circuit diagram for the circuit used in this project.
Careers
If you like this project, you might enjoy exploring these related careers:


Contact Us
If you have purchased a kit for this project from Science Buddies, we are pleased to answer any question not addressed by the FAQ above.In your email, please follow these instructions:
- What is your Science Buddies kit order number?
- Please describe how you need help as thoroughly as possible:
Examples
Good Question I'm trying to do Experimental Procedure step #5, "Scrape the insulation from the wire. . ." How do I know when I've scraped enough?
Good Question I'm at Experimental Procedure step #7, "Move the magnet back and forth . . ." and the LED is not lighting up.
Bad Question I don't understand the instructions. Help!
Good Question I am purchasing my materials. Can I substitute a 1N34 diode for the 1N25 diode called for in the material list?
Bad Question Can I use a different part?
Contact Us
Related Links
- Science Fair Project Guide
- Other Ideas Like This
- Biotechnology Project Ideas
- Cooking & Food Science Project Ideas
- My Favorites
- How to Use a Breadboard for Electronics and Circuits
- Laser Safety Guide


