Abstract
Why is it more comfortable to wear light-colored clothes on a hot summer day? Why wear a dark-colored jacket for early-morning fishing on a cold lake? How much difference can it make? Here's a project where you can quantify how much difference color makes for absorbing heat.Summary
Andrew Olson, Ph.D., Science Buddies
Sources
- This idea is from an entry to the 2007 San Mateo County science fair (author's name not provided).
Objective
The goal of this project is to see how the color of an object affects how much heat it absorbs when exposed to incandescent light.Introduction

Light is an example of an electromagnetic wave. Electromagnetic waves can travel through the vacuum of interstellar space. They do not depend on an external medium—unlike a mechanical wave such as a sound wave which must travel through air, water, or some solid medium. Electromagnetic waves cover a huge range of frequencies, from high-frequency gamma rays and x-rays, to ultraviolet light, visible light, and infrared light, and on into microwaves and radio waves. As the frequency decreases, so does the energy. The wavelength of an electromagnetic wave is inversely proportional to its frequency. So waves with high frequency have short wavelengths, and waves with low frequency have long wavelengths.
Electromagnetic waves interact with materials in different ways, depending on the nature of the material and the frequency of the electromagnetic wave. Light is the range of electromagnetic waves that are visible (Figure 1). For humans, the range of visible wavelengths is from 400 to 700 nm (1 nm = 1 ×10⁻⁹ m).
 Image Credit: Abrisa Glass and Coatings / Copyrighted
The electromagnetic spectrum extends from very short wavelength gamma rays to very long wavelength radio waves. The focus of this diagram is to display the portion of the spectrum that is visible to the human eye in the form of colors. Wavelengths between 400 and 700 nanometer are visible as colors and make up a very small portion of the electromagnetic spectrum.
Figure 1. The visible spectrum. X-rays, light, and radio waves are examples of electromagnetic waves. Light is the part of the electromagnetic spectrum that we can detect with our eyes. At the blue end of the visible spectrum, the wavelength of light is shorter (about 400 nm). At the red end of the spectrum, the wavelength of light is longer (about 700 nm) (Illustration from Abrisa Glass & Coatings, 2005).
This range of wavelengths is called the visible spectrum of light. When you see a rainbow in the sky, or white light that has been refracted through a prism, or diffracted by the regular surface of a CD, you are seeing a spectrum of colors. The different colors are related to the different wavelengths of light. Violet light is at the short-wavelength end of the visible spectrum (400 nm), and red light is at the long-wavelength end of the visible spectrum (700 nm), with the rainbow of colors in between.
We perceive different colors because our visual system has evolved to make use of the spectral information in reflected light. When light interacts with an object, the light can be absorbed by the object, reflected by the object, or transmitted by the object.
For example, when you look at yourself in the mirror, the light that you are seeing has been reflected by the mirror, transmitted through the air, through your cornea, through the lens of your eye, and through two layers of cells in your retina before it is absorbed by light-sensitive pigments in your photoreceptor cells. The energy from the absorbed light starts a cascade of chemical reactions in your photoreceptors that ultimately leads to your perception: seeing yourself in the mirror.
Objects in the world have different colors depending on which parts of the visible spectrum they absorb, and which parts of the visible spectrum they reflect. Red objects reflect long wavelengths of light (and absorb shorter wavelengths), while blue objects reflect short wavelengths of light (and absorb longer wavelengths). Black objects absorb all visible wavelengths about equally, and white objects reflect all visible wavelengths about equally.
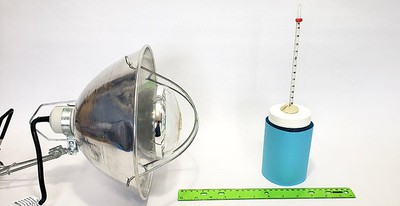
Light that is absorbed by an object is usually converted into heat energy. The goal of this project is to measure how much heat is produced by the absorption of light by different colors. You'll use an incandescent light (a heat lamp), and water-filled jars wrapped with different colors of construction paper. By measuring how much the temperature of the water increases, you'll have a measure of how much light was absorbed by each color.
Before you get started, study Figure 2 and then try to predict what your results will be. The graph compares the spectrum of sunlight with the spectrum of an incandescent bulb. You can see that sunlight has much more energy (brightness) in the range of visible wavelengths (gray shaded region), while the incandescent bulb has more energy in the red and infrared (invisible, longer-wavelength electromagnetic radiation) region of the spectrum.
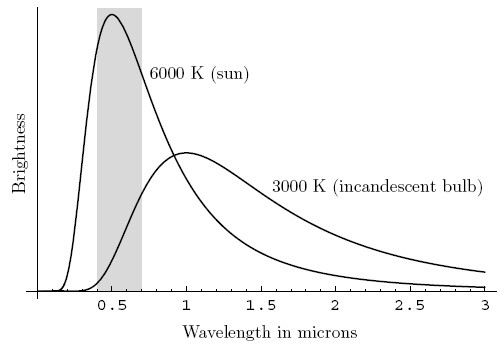
The example graph measures the brightness and wavelength of sunlight and the light from an incandescent bulb. Sunlight is much brighter but mainly consists of light at a wavelength of 0.5 microns. Light from an incandscent bulb is about half as bright as sunlight and mostly consists of light with wavelengths between 0.75 and 2.25 microns.
Figure 2. A comparison of the spectrum of sunlight vs. the spectrum of an incandescent bulb (Schroeder, 2003). The x-axis shows the wavelength (in microns), and the y-axis shows the relative energy (brightness) at each wavelength. The gray region corresponds to the visible region of the spectrum (0.4–0.7 μm = 400–700 nm).
Terms and Concepts
To do this project, you should do research that enables you to understand the following terms and concepts:- Electromagnetic spectrum
- Visible light
- Ultraviolet light
- Infrared light
- Absorption of light
- Reflection of light
Questions
- How does an incandescent light bulb work?
- What wavelength is the peak output for an incandescent bulb?
Bibliography
For more information on how light interacts with matter, see:
- Hoff, K. Mellendorf and V. Calder. (n.d.). Reflection and Absorption. NEWTON Ask a Scientist, Physics Archive, Argonne National Laboratory, Division of Educational Programs. Retrieved February 23, 2007.
For a high-school level reference on color and vision, see:
- Wikipedia contributors. (2007). Color. Wikipedia, the Free Encyclopedia. Retrieved February 23, 2007.
Advanced. For more information on the distribution of energy in light sources, see:
- Schroeder, D.V. (2003). Radiant Energy. Online chapter for the course, 'Energy, Entropy, and Everything,' Physics Department, Weber State University. Retrieved February 23, 2007.
Materials and Equipment
- 6–8 identical glass jars, 1 quart size, with lids
- 6–8 sheets of colored construction paper (different colors)
- Scissors
- Tape
- Water
- Thermometer, such as this partial immersion thermometer from Carolina Biological Supply Company
- Modeling clay
- Heat lamp, such as this brooder lamp from Carolina Biological Supply Company. Heat lamps are also available at hardware stores. Make sure you buy a 250 watt or greater heat lamp bulb. The project will not work as well with regular light bulbs.
- Timer or clock
- Drill and bit for making holes in jar lids
Disclaimer: Science Buddies participates in affiliate programs with Home Science Tools, Amazon.com, Carolina Biological, and Jameco Electronics. Proceeds from the affiliate programs help support Science Buddies, a 501(c)(3) public charity, and keep our resources free for everyone. Our top priority is student learning. If you have any comments (positive or negative) related to purchases you've made for science projects from recommendations on our site, please let us know. Write to us at scibuddy@sciencebuddies.org.
Experimental Procedure
- Drill a hole slightly larger than the diameter of your thermometer in the lid of one jar. (In this project you'll be testing the jars one at a time, so you can use the same lid with each jar.)
- Tightly wrap each jar with a different color of construction paper and secure the paper with tape. Make sure the paper is flat against the jar and there is no air gap in between them. This will help make sure that heat can transfer from the paper to the glass.
- Carefully fill each jar with water.
- Keep the construction paper dry.
- You need to have the same starting temperature for each jar. The easiest way to do this is to have all of the jars at room temperature. Fill them with water that is about the same temperature the day before you want to start your experiment. Cover the jars and leave them to equilibrate to room temperature overnight.
- Cover the jar to be tested with the lid with the drilled hole.
- Put the thermometer in through the hole so that its bulb is completely immersed in the water. Use the clay to seal the hole and hold the thermometer in place. The rest of the thermometer will be out of the jar, and you should still be able to take readings with it. Keep the thermometer at the same height with respect to the jar lid for all of the tests.
- Note the starting temperature for each jar.
- Next, set up your heat lamp in a convenient location, so that it can shine directly at the side of a jar placed between 15–30 cm away. (Decide on an exact distance, and use it for all of the tests.)
- Set the jar to be tested at the correct distance, centered in front of the heat lamp.
- Leave the jar in front of the lamp for a set amount of time (e.g., 30 min), and check the temperature of the jar when that time has elapsed.
- Be sure to make the time interval long enough so that there is a measurable increase in temperature.
- Be sure to use the same time interval for each jar.
- Repeat until all of the jars have been tested.
- You should do at least three separate trials for each color, with each trial starting with water at room temperature. (It may take more than one day to do your measurements, so plan ahead!)
- Analyze your results.
- What was the average increase in temperature for each color?
- Make a bar graph to show your results, ordering the colors from lowest to highest temperature increase.
- How does the arrangement of the colors in your bar graph compare to the spectrum of incandescent light?
Ask an Expert
Variations
- Compare temperatures of the jars when exposed to sunlight instead of incandescent light. You'll need a separate thermometer for each jar, and a location where all of the jars receive the same amount of sunlight for a defined time period. As in the experiment described above, you should conduct at least three separate trials. How does the spectrum of sunlight compare to the spectrum of incandescent light? Are the results of your experiment the same or different with sunlight compared to incandescent light?
- For a more basic experiment, see the Science Buddies project Can the Color of Your House Reduce Your Energy Footprint?.
Careers
If you like this project, you might enjoy exploring these related careers: