Abstract
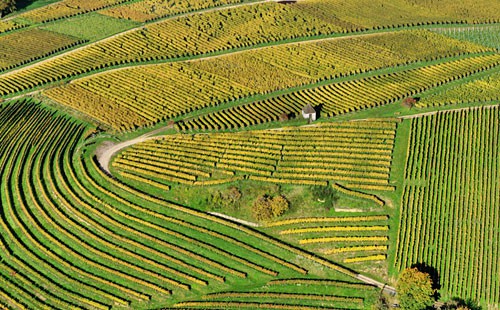
Wondering what sustainable, high-producing agriculture might look like? This science project explores how analyzing bird's-eye-view pictures of a field can make farmers aware of variations in their fields. Farmers can use this information to optimize their farming practices, or even feed this information to high-tech agricultural equipment so the machines can automatically adjust their actions (like fertilizing or watering) to the needs of a piece of land.Summary

Objective
Establish a procedure so a computer can infer the fraction of ground covered by grass using the color histograms of a bird's-eye picture of the area.
Introduction
Making sure people have food is always a challenge, and more people in the world means more people to feed. With world population estimates showing continued rapid growth (see Figure 1), it is important to find new and sustainable ways to produce enough food to feed everyone.
 Image Credit: Creative Commons Attribution-Share Alike 4.0 International
A graph of the world population between 1800 and 2100 shows projections that the human population can grow anywhere from 7.5 billion at the low end to 16.5 billion at the high end.
Figure 1. World population estimates from 1800 to 2100, based on "high," "medium," and "low" United Nations projections in 2015 and UN historical estimates for pre-1950 data. (Image credit Wikimedia Commons user bdm25, 2016.)
No single solution can solve the challenge of feeding the world's growing population, but a shift in agricultural management and use of agricultural technology can make a difference.
Traditionally, to determine how their crops were doing, farmers would take a few samples from fields or crops and then make decisions for all the fields or crops. The problem with this is that conditions may not be the same for all fields or even for all parts of a single field. Modern agricultural technology allows farmers to account for spatial variability and move towards precision agriculture or site-specific crop management. These are management styles in which decisions are based on site-specific data and fields or crops are treated locally, according to their specific needs.
New technologies like satellite and drone pictures, GPS (Global Positioning System), GIS (Geographic Information System) and automated on-the-ground sensing stations allow farmers to automatically collect local data and have it analyzed by computers on an ongoing basis. Reports from these systems help farmers keep track of all of their crops, including local variations, and may alert farmers to site-specific problems. This allows farmers to more effectively treat (e.g., water, fertilize, or harvest) individual fields, crops, and sites.
For farmers to reap the benefits of precision agriculture or site-specific crop management, computers need to be able to extract useful information from raw data. What can computers tell from analyzing pictures of a farmer's fields? The overall health and size of a crop is often related to the color and coverage of its canopy. It is easy for a human to differentiate a green field filled with healthy vegetation from a dry and bare one when looking at an aerial (or bird's-eye) picture of the field, but can computers be programmed to interpret these images and assess fields based on color? In this science project, we will look at how computers can analyze and infer valuable information from digital images.
Computers "see" a digital image as an array of light intensity values for the colors red, green, and blue. For each pixel (dot) in the image, the array stores the amount (or intensity) of red, green, and blue light present as a value between 0 (complete darkness) and 255 (maximum light intensity). The color of each pixel in the image is the result of the addition of the specific intensity of red, green, and blue (R, G, and B) for that pixel. Note that digital images use the additive color system, where combining red, green, and blue results in white.
The statistical distribution of intensity values in the image is referred to as the histogram of the image. A histogram shows how many pixels in the image have a specific light intensity value. Your image editing software may display several types of histograms. In this project, you will use image histograms for individual colors to analyze birds'-eye pictures. Figure 2 shows two different images with their histograms for the green channel. The horizontal axis shows the light intensity, going from 0 (dark) on the left to 255 (light) on the right. The height of a bar in the histogram represents the number of pixels of that specific light intensity in the image.
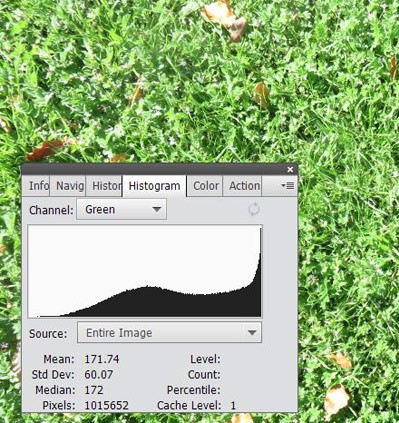 Image Credit: Sabine De Brabandere, Science Buddies / Science Buddies
Image histogram shows the light intensity values of pixels for a photo of grass in the green channel. The histogram shows a slight concentration of light values near the center of the histogram and a large concentration of light values at the top end of the histogram. The mean pixel value is 171.74, the standard deviation is 60.07 and the median value is 172.
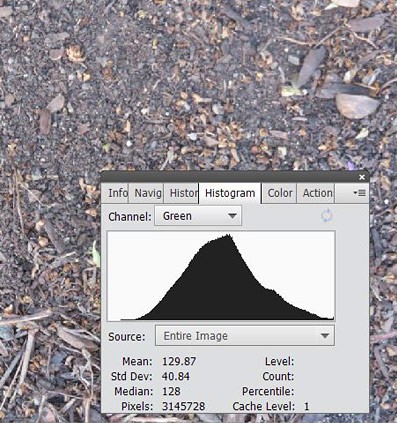 Image Credit: Sabine De Brabandere, Science Buddies / Science Buddies
Figure 2. A picture of grass and one of dirt with their color histogram for the channel green.
Many image programs also have an option to show the histogram in color, with all colors R, G, and B values shown (as in Figure 3). Where R, G, or B values overlap, you will see other composite colors (like yellow). Your program may also offer a histogram that shows the average of the intensity in the R, G, and B channel (shown in Figure 4). Note: your specific image editing software may label the histograms differently than the examples shown.
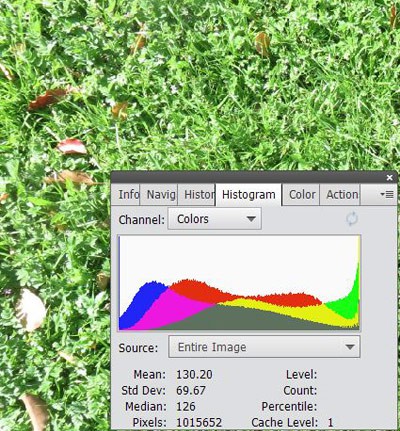 Image Credit: Sabine De Brabandere, Science Buddies / Science Buddies
Image histogram shows the light intensity values of pixels for a photo of grass in three color channels. The histogram shows a slight concentration of light values near the center of the histogram and a large concentration of light values at the top end of the histogram for the green channel. The red and blue channels both show large concentrations of light values for pixels at the lower end of the histogram. The mean pixel value is 130.2, the standard deviation is 69.67 and the median value is 126.
 Image Credit: Sabine De Brabandere, Science Buddies / Science Buddies
Figure 3. A picture of grass and one of dirt with the light intensity distribution for all three channels (R, G, and B) visible in the histogram.
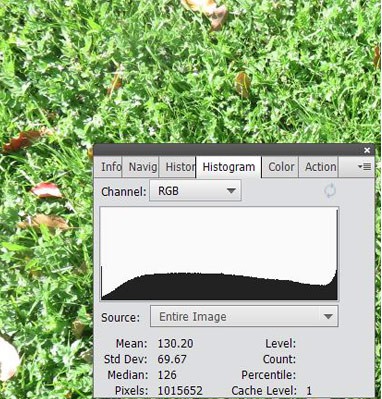 Image Credit: Sabine De Brabandere, Science Buddies / Science Buddies
Image histogram shows the average light intensity values of pixels for a photo of grass in the RGB channel. The histogram shows relatively even light values from the beginning to end of the graph with a large concentration of light values at the top end of the histogram. The mean pixel value is 130.2, the standard deviation is 69.67 and the median value is 126.
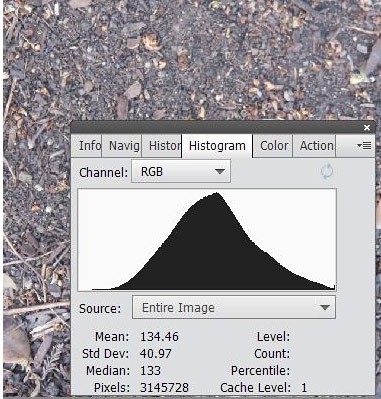 Image Credit: Sabine De Brabandere, Science Buddies / Science Buddies
Figure 4. A picture of grass and one of dirt with the distribution of the average light intensity over all three channels (R, G, and B).
How can an image histogram help farmers better assess and monitor their lands and crops? What information can analysis of the "color" of the canopy of lands and crops provide farmers? Can you teach a computer to look at a photo of a field and analyze the photo based on color to provide information to a farmer? In this science project, you will experiment with a procedure that would enable a computer to estimate the amount of grass coverage of an area based on histograms of a bird's-eye (or aerial) picture of the area.
Terms and Concepts
- Precision agriculture
- Site-specific crop management
- Aerial photography
- Additive color system
- Statistical Distribution
- Histogram
- Algorithm
Questions
- How can aerial photography provide useful information for farmers or government agencies? How might they use the information?
- What do you expect to see in the green, the red, and the blue channel histograms of a bird's-eye picture of a grass field? How would these histograms be different from histograms of a bird's-eye picture of bare land?
- How might areal photography contribute to precision farming and in what ways might precision farming help feed a growing population?
Bibliography
- Ranganathan, J (2013, Dec 3) The Global Food Challenge Explained in 18 Graphics World Resources Institute. Retrieved April 20, 2017.
- Broughton, J (2015, July 6) How Farmers Are Harvesting Big Data Inc. Retrieved April 18, 2017.
- Rutter, A (2016, March 31) Case Study: Why This Farmer Says FarmLogs Will Save Him $16,000 A Year FarmLogs. Retrieved May 8, 2017.
- Lukina,E.V. et al (1999) Estimating Vegetation Coverage in Wheat Using Digital Images Journal Of Plant Nutrition, volume 22. Retrieved April 18, 2017.
- McHugh, S (n.a.) Camera Histograms: Luminosity & Color Cambridge Colour. Retrieved April 18, 2017.
Materials and Equipment
- Green construction paper (4 sheets)
- Brown construction paper (4 sheets)
- Scissors
- Digital camera
- Computer with image editing software with a histogram tool, like Adobe Photoshop or GIMP.
- Patch of well-established grass
- Patch of bare ground
- Patches with a combination of established grass and bare ground, or the ability to combine pieces of two images using image editing software.
- Lab notebook
Experimental Procedure
In this science project, you will experiment with a procedure that would enable a computer to estimate the amount of grass coverage of an area based on histograms of a bird's-eye (aerial) picture of the area.
First, you will use pictures of green and brown construction paper to establish a procedure to determine what fraction of a picture is covered in green. Later, you will refine your procedure using pictures of grass and dirt. Finally, you will test how well the procedure can infer the fraction of an area covered in grass from a bird's-eye picture of the area and evaluate the strengths and weaknesses of your procedure.
Note: since different image editing programs are available, we did not write this procedure with specific instructions for one program. You may need to look up a tutorial or read the help files to learn how to use the histogram tool in your program of choice.
Establishing a Procedure
- Create a portfolio of pictures using green and brown construction paper.
Use your construction paper to create images with the fractions of green and brown noted below. Consider following tips as you take the pictures listed below:
- Keep the camera settings constant.
- Try to keep the light conditions similar for all pictures and avoid casting a shadow on the paper.
- Put the papers on the floor and hold the camera above them, looking down at the paper. If your camera has a zoom feature, increase the distance between the camera and the paper and use the zoom to fill the frame completely with the construction paper.
Take three bird's-eye view pictures (or pictures where the camera looks down at the object) of each of the following:
- Green construction paper
- Brown construction paper
- Pictures where the frame is half covered with solid green and half covered with solid brown
- Pictures where the frame is a quarter covered with solid green and three quarters covered with solid brown
- Pictures where the frame is three quarters covered with solid green and a quarter covered with solid brown
- Pictures where the frame is overall two thirds green and one third brown. Instead of solid brown, break the brown up into several patches scattered around the green background. An example is shown in Figure 5.
- Repeat step f for pictures where the frame is one-third green patches scattered on a brown background.
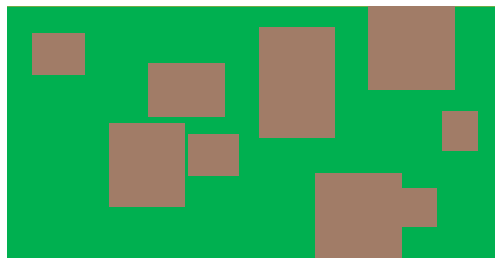 Image Credit: Sabine De Brabandere, Science Buddies / Science Buddies
Figure 5. Brown patches scattered around a green background.
- Find an algorithm to distinguish green from brown.
- Open a picture of solid green construction paper in your image editing program and open the histogram window for the picture.
- Repeat step a for a picture of solid brown construction paper.
- Compare the histograms of both pictures.
- Is the distribution of the green channel very different?
- How does the green channel compare to the other color histograms for each image? Do you see considerable differences?
- Find a way to differentiate the green construction paper from the brown by looking only at the histograms of the pictures.
For example, if green construction paper shows a clear peak in the green channel at high intensity values (e.g., above 180), while the distribution in the green channel for the brown construction paper is clearly lower, you might infer that a clear peak in the green channel at high intensity values indicates a green picture.
- Use what you found in step d to write an algorithm that a computer could execute to analyze a picture and determine the fraction of the image covered in green. An algorithm is a sequence of steps that are followed with the aim of solving a problem.
For the example above, a computer can calculate the percentage of the green distribution above a cut-off value (e.g., 180) and report this percentage as the fraction of the paper covered by green.
Note: many image editing programs can display the percentage of pixels in a specific intensity value range. Figure 6 shows that 58.2% of the pixels in the image have a green intensity value between 154 and 255. You might need to consult your program's tutorial to find this feature. If it is not available, consider using GIMP, a free, open source image editing program.
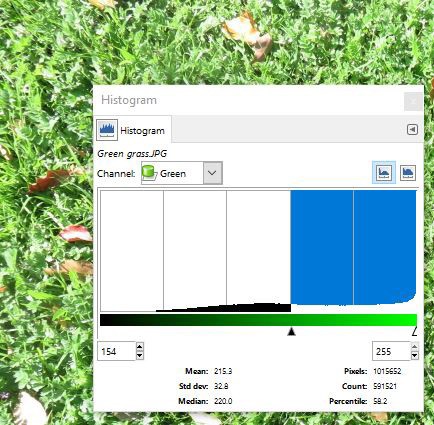 Image Credit: Sabine De Brabandere, Science Buddies / Science Buddies
Screenshot of a histogram shows a range highlighted from the average light intensity values of pixels for a photo of grass in the channel green. The histogram shows relatively even light values from the beginning to end of the graph with a small concentration of light values at the top end of the histogram. The mean pixel value is 215.3, the standard deviation is 32.8 and the median value is 220.
Figure 6. Evaluating the percentage of pixels falling in a selected intensity range.
- Test your algorithm.
To see if your algorithm is effective, you will apply the algorithm for the green and brown construction paper images you created.
- Look back at the histogram of the image of solid green construction paper. Apply the algorithm you created in step 2.e to calculate the fraction of the image covered in green. Record your result in a table like Table 1. This completes the first trial for green construction paper.
- Open the second picture of solid green construction paper in your image editing software. Open the histogram window and apply the algorithm. Record your result in a table like Table 1.
- Repeat step b one more time for the third picture of green construction paper.
- Repeat steps a to c for all other types of pictures.
| Picture type | Fraction covered in green | Measured fraction covered in green | Average measured fraction covered in green | ||
|---|---|---|---|---|---|
| Trial 1 | Trial 2 | Trial 3 | |||
| Green construction paper | 1 | ||||
| Brown construction paper | 0 | ||||
| Half green, half brown | 1/2 | ||||
| One quarter green, three quarters brown | 1/4 | ||||
| Three quarters green, one quarter brown | 3/4 | ||||
| Two thirds green, one third brown | 2/3 | ||||
| One third green, two thirds brown | 1/3 | ||||
- Analyze your data.
- Calculate the average measured fraction covered in green for each type of picture.
- Create a graph. Plot the real fraction covered in green (from 0 to 1) on the x axis and the average measured fraction covered in green on the y axis.
- Draw the line of best fit through your data points.
- What information is revealed by the y intercept?
- What information do you get from the slope of the line?
- Evaluate your algorithm.
- Looking at your data and graph, would you say your algorithm works well to estimate the fraction of a picture of brown and green construction paper that is covered in green?
- If you are not satisfied, go back to step 2 and refine your algorithm before you test a similar algorithm on pictures of real vegetation and dirt.
Test Your Procedure on Pictures of Real Grass and Dirt
- Gather a portfolio of pictures.
Below are some tips to consider while taking pictures:
- Keep the camera settings constant.
- Try to keep the light conditions similar for all pictures and avoid pictures of grass or dirt in direct sunlight.
- Take all pictures from the same distance above the ground, shoulder height or higher.
Take at least three bird's-eye pictures of each of the following:
- Well-established grass
- Dirt
- Pictures where the frame is partially filled with grass and partially filled with dirt. You may need to scout for areas where you can find grass bordering dirt. If you are not able to find such a location, you can buy patches of grass and lay them on dirt, or lay dirt over a patch of grass. Make sure you are able to remove the dirt after you took the pictures. If none of these are possible, you can use your image editing program to create these images by combining parts of other images.
- Write an algorithm to differentiate grass from dirt in your pictures.
- Open a picture of grass and one of dirt in your image editing program and open the histogram window for each.
- Compare the histograms.
- Evaluate if you see a pattern similar to what you saw when comparing pictures of green and brown construction paper.
- Adjust your algorithm or the cut-off value(s) you established for construction paper so that your algorithm is better suited to distinguish grass from dirt.
- Note: your algorithm to distinguish grass and dirt will probably not work as well as the algorithm to distinguish green from brown construction paper. Why do you think this is the case?
- Test your new algorithm.
To see if your algorithm is effective, you will test the algorithm for the bird's-eye photos you took of grass and dirt.
- Apply your algorithm and calculate the fraction of a photographed area that is covered in grass for all the pictures you took. Write your result in a table like Table 2.
| Picture type | Fraction covered in grass | Measured fraction covered in grass | Average measured fraction covered in grass | ||
|---|---|---|---|---|---|
| Trial 1 | Trial 2 | Trial 3 | |||
| All grass | 1 | ||||
| All dirt | 0 | ||||
| Partially covered in grass | |||||
| Partially covered in grass | |||||
| Partially covered in grass | |||||
- Analyze your data.
- Calculate the average measured fraction of grass for each picture.
- Create a graph. Plot the real fraction covered in grass (from 0 to 1) on the x axis and the average measured fraction covered in grass on the y axis.
- Draw the line of best fit through your data points.
- What information is revealed by in the y intercept?
- What information do you get from the slope of the line?
- How can this line help you get a better estimate for the fraction covered with grass?
- Evaluate your algorithm.
- Looking at your data and graph, would you say your algorithm works well to estimate the fraction of an area covered in grass?
- If time allows, you can always go back to step 2 and improve or extend your algorithm.
- Evaluate your procedure
- Write out a step-by-step sequence of actions for the procedure you established. Note: you first calibrated your algorithm to be sensitive to the specific colors you wanted to distinguish (e.g., green versus brown construction paper, grass versus dirt). This is part of your procedure.
- In this project, you performed all the work. Would a computer be able to take over all or most of the work? Why or why not?
- What are some of the strengths and weaknesses of your procedure?
- What are some ways to improve the procedure?
- How could this type of procedure be useful to farmers? In what other industries might a procedure like this be useful?
Ask an Expert
Global Connections
The United Nations Sustainable Development Goals (UNSDGs) are a blueprint to achieve a better and more sustainable future for all.

Variations
- This project advises you to use pictures taken in similar light conditions. Study how changing light conditions might affect the results or effectiveness of an algorithm, or find ways to correct for changing light conditions.
- In this project, you used pictures taken at a specific distance from the ground. Study how increasing the distance affects your result. Would increasing the distance increase or decrease the accuracy of your procedure?
- If you have a drone with a camera available, use it to take pictures of grass fields and/or other fields and establish a procedure to evaluate vegetation coverage from these pictures.
- This project uses only the spectrum of reflected visible light to calculate vegetation coverage. Other methods use the spectrum of reflected near-infrared light in addition to the spectrum of reflected visible light to evaluate biomass or vegetation coverage. Look up references on the Normalized Difference Vegetation Index (NDVI) for ideas about how to use both spectra in your procedure.
- Use real satellite images and their spectra to establish a procedure. This document can help you find satellite images.
Careers
If you like this project, you might enjoy exploring these related careers:


Related Links
- Science Fair Project Guide
- Other Ideas Like This
- Environmental Science Project Ideas
- Photography, Digital Photography & Video Project Ideas
- Agricultural Technology Project Ideas
- My Favorites