Abstract
Did you know that the most likely time to be struck and killed by a car in the United States is at dusk, dawn, or at night? In 2014, 3 out of every 4 pedestrian fatalities happened in these types of poor light conditions. Is there something you could do to decrease the chances you, your friends, and your family members are safer when walking or biking at night? Do you think the types of clothes that you wear could make a difference in how visible you are to drivers? Explore the science of staying visible and safe at night with this science project; what you discover might save someone's life.
Summary
None
Readily available
Adult supervision is required when performing the test after dark.
/-/https/www.sciencebuddies.org/cdn/Files/8280/11/test-garments.jpg)
Objective
Study the distance from which a car driver can see a pedestrian wearing a dark shirt, a bright yellow shirt, fluorescent yellow clothing, or clothing equipped with retro-reflective strips.
Introduction
In 2014, 4,884 pedestrians died in car crashes in the United States and 65,000 more were injured. In other words, on average, 13 pedestrian die in America in a traffic accident every day —that is about 1 every 2 hours! For injuries, it is one pedestrian every 8 minutes, which is about 180 per day, as shown in Figure 1.
/-/https/www.sciencebuddies.org/cdn/Files/8277/11/injury-cartoon-pedestrians.jpg)
Figure 1. Drawing illustrating pedestrian injury and fatality statistics obtained from the 2014 Traffic Safety Factsheet listed in the Bibliography.
It is important to note that these accidents did not happen regularly all throughout the day. Figure 2 reveals that more than 3 out of every 4 pedestrian fatalities occurred in poor light conditions, like dawn, dusk, or at night. Compare this to the distribution of fatalities for cyclists, which is about an even number of fatalities occurring during dark and during daylight conditions.
/-/https/www.sciencebuddies.org/cdn/Files/8278/12/pedestrians-cyclists-fatalities-data.jpg)
Two graphs show the light conditions during cyclist (left) and pedestrian (right) fatalities in the United States during 2014. For cyclists 50 percent of the fatalities happened in daylight, 44 percent happened in the dark and 3 percent happened each at dusk and dawn. Pedestrian fatalities occur at a much higher rate in the dark at 72 percent, 24 percent of fatalities happened in the day and 2 percent happened each at dusk and dawn. Yellow sections of the graph are daylight, grey sections are dark, blue is dusk and orange is dawn.
Figure 2. Pie charts illustrating the percentage of pedestrian and cyclist fatalities that happen during different light conditions. Data retrieved from 2014 Traffic Safety Factsheets listed in the Bibliography.
This raises questions, such as why are pedestrians so vulnerable during poor light conditions? What can a pedestrian do to be better seen?
You probably know that camouflage makes you disappear in the background, but would "not being camouflaged," as shown in Figure 3, be enough to be more visible at night?
/-/https/www.sciencebuddies.org/cdn/Files/8279/11/camouflaged-pedestrian.jpg)
Figure 3. Wearing garments that stand out with respect to the background (positive contrast), increase the chances of being seen compared to wearing garments that blend in with the background (negative contrast).
Humans "see" objects because light that reflects off an object reaches our eye. At night, there is very little light, so it is hard for us to see objects. Would some colors help get more light into our eyes, so we could see them better? Materials with bright colors bounce off more light than dark-colored objects do. Fluorescent objects send out visible light when high-energy light shines onto them, and retro-reflective material—often referred to as reflective material— bounces back all the light that shines onto it. Figure 4 shows materials in these three "colors" in ample light conditions. Which one do you think will increase visibility the most in poor light conditions?
/-/https/www.sciencebuddies.org/cdn/Files/8280/11/test-garments.jpg)
Figure 4. This picture shows a bright yellow t-shirt and helmet, a yellow fluorescent garment, and a safety vest equipped with retro-reflective stripes in daylight.
In this science project, you will rate how much these different types of clothes increase the visibility of a pedestrian placed at 25 meters (m), 50 m, 100 m, and 150 m away from a car with its low-beam headlights on.
Figure 5 shows how far a car travels, on average, during the reaction time of the driver (blue bar) and while the car brakes to get to a standstill (orange bar). The reaction time of the driver is the time it takes for the driver to react to a stimulus, like seeing a pedestrian. Knowing these distances for different initial speeds of a car can help place your test results in context.
/-/https/www.sciencebuddies.org/cdn/Files/8281/11/stopping-distance.jpg)
The example graph measures the speed (miles per hour) of an incoming car and the distance (meters) required for the car to come to a complete stop. The graph shows that as a cars speed increases, the distance required to stop increases. The slowest speed listed for a car is 35 mph and at that speed a car needs 25-30 meters to stop completely. The highest speed listed is 80 mph and at that speed a car needs about 125-150 meters to stop completely.
Figure 5. Graph showing how far a car travels between the driver observing a stimulus and him/her reacting to it (blue bar) and the car braking to get to a standstill (orange bar). The total bar shows how far a car travels between observing a stimulus and coming to a stop for different initial speeds.
Terms and Concepts
- Pedestrian
- Fatality
- Bright color
- Fluorescence
- Retro-reflective or reflective
- Reaction time
Questions
- Figure 2 shows that more than 3 out of 4 pedestrian fatalities occur in poor light conditions, while for cyclists, it is 2 out of 4. Can you state some reasons that might explain this difference?
- Do you expect that adding retro-reflective strips to your clothing will make you more visible at nighttime? The explanation of the term retro-reflective is given in the introduction and can help you reason through this question.
- Why might clothing that increases your visibility during the day be so different from clothing that makes you stand out at night? Knowing that sunlight contains ultraviolet light, while street lights and car lights generally do not contain ultraviolet light, might help you find one reason.
Bibliography
- National Highway Traffic Safety Administration. (n.d.). Driving Safety: Pedestrians. Retrieved October 6, 2016.
- National Highway Traffic Safety Administration. (2016, May). Traffic Safety Facts, 2014 Data, Pedestrians. Retrieved October 6, 2016.
- National Highway Traffic Safety Administration. (2016, May). Traffic Safety Facts, 2014 Data, Bicyclists and Other Cyclists. Retrieved October 6, 2016.
- The Reflectory. (2015). Reflector Education. Retrieved October 13, 2016.
- Kids.Net.Au. (n.d.). Fluorescence. Retrieved October 13, 2016.
For help creating graphs, try this website:
- National Center for Education Statistics, (n.d.). Create a Graph. Retrieved June 25, 2020.
Materials and Equipment
- A tool that allows you to measure 25, 50, 100, and 150 m. Some options are:
- Rolls of twine (6), each 25 m long; like this one, available from Amazon.com.
- Phone app that can keep track of the distance walked from a starting point
- Tape measure
- Optional: Painter's tape
- Black or dark clothing covering most of the body
- Bright yellow garment, preferably covering the torso
- Yellow safety vest with retro-reflective taping; like the safety vest available from Amazon.com.
- Yellow fluorescent garment; if you buy the safety vest listed above, you can use the fluorescent bag (side without the retro-reflective band) as the fluorescent garment.
- Car
- Street or parking lot with the following features:
- There is no or very little streetlight or other lighting after dark.
- There is a spot where you are allowed to park a car, and where there is a safe, open space of at least 150 m straight ahead of the car.
- There is no or minimal traffic during your experiment.
- Flashlights (2); add one flashlight for each additional person who will join you to take the data.
- Adult assistant to operate the car and supervise any activities outside after dark.
- Assistant to run the test; this can be the adult supervising you and operating the car. Note: The assistant running the test must also wear black or dark clothes.
- Lab notebook
Disclaimer: Science Buddies participates in affiliate programs with Home Science Tools®, Amazon.com, Carolina Biological, and Jameco Electronics. Proceeds from the affiliate programs help support Science Buddies, a 501(c)(3) public charity, and keep our resources free for everyone. Our top priority is student learning. If you have any comments (positive or negative) related to purchases you've made for science projects from recommendations on our site, please let us know. Write to us at [email protected].
Experimental Procedure
Preparing Your Test
- Observe visibility at night.
- Whenever you are in the car after dark, observe what you can see, and what is surprisingly hidden until it is almost next to you. These observations together with the information given in the Introduction help you make a hypothesis for your project. Take pictures with a camera, like Figure 6. They will help you convey your message on a science project display board.
/-/https/www.sciencebuddies.org/cdn/Files/8282/11/nighttime-jogger.jpg)
Figure 6. Jogger out at night.
- Find a good location at which to perform your test.
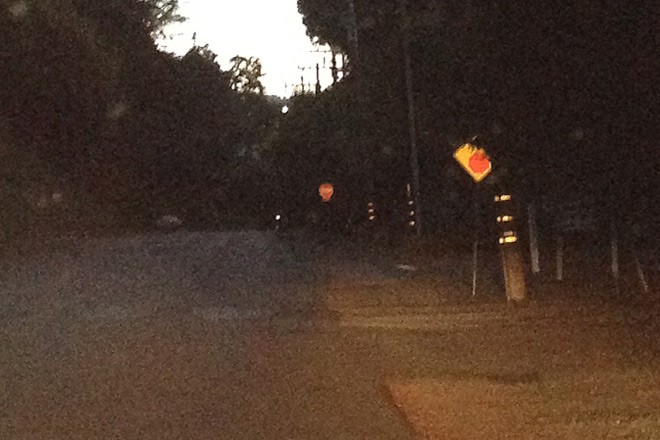
Figure 7. Quiet, non-lit street that would be suitable as the visibility test location. - Find an adult who is willing to help you.
- Prepare a data table in which to collect all your data.
/-/https/www.sciencebuddies.org/cdn/Files/8283/15/nighttime-streetview.jpg)
| Trial # ___ | Visibility at specific distances straight ahead of a car with low beams turned on. Rating from 0 (not visible) to 10 (clearly visible) | |||
|---|---|---|---|---|
| 25 m | 50 m | 100 m | 150 m | |
| Garment with retro-reflective stripes | ||||
| Fluorescent yellow garment | ||||
| Bright yellow garment | ||||
| Black attire | ||||
Table 1. Table in which to collect the data of one trial. You will need 4 tables, one for each trial.
- Decide how you will measure a distance of 25, 50, 100, and 150 m from a parked car.
- If you feel uncomfortable determining the distances of 25, 50, 100, and 150 m once it is dark outside, mark the distances with tape on the road before it gets dark.
- Read the Gathering Data section. If you feel unsure about it, practice the data-gathering procedure during the daytime before you go out after dark.
- Find an assistant.
Gathering Data
- Do the following before you leave.
- Dress in black.
- Gather the bright yellow, the fluorescent, and the retro-reflective garments you would like to test.
- Take one flashlight for yourself and one for each person joining you.
- Take your lab notebook and pen.
- If you have not measured off the distances yet, take any equipment you need to measure the distances in front of the car.
- Set up the test at the selected location.
- Have the car parked, with the low-beam headlights on.
- Agree with your assistant on easy light signals (like a short flash) to communicate "Please evaluate," and the possible replies: "I see you," and "I do not see you." Agree on a signal to communicate "Look out, danger!".
- In the next steps, you will walk to the different distances, starting with 25 m. Your assistant will go and sit in the front passenger seat of the car. Once you reach a distance mark, signal your assistant to evaluate. At that time, your assistant will evaluate (on a scale from 0 (non-visible) to 10 (highly visible)) how well he or she sees you and write the finding down in a table like Table 1. After writing down the number in the data table, he/she returns your question with the signal "I see you" if the evaluation was between 1 and 10, or "I do not see you" if the evaluation was 0. Go over this procedure with your assistant.
/-/https/www.sciencebuddies.org/cdn/Files/8284/15/visibility-test-setup.jpg)
/-/https/www.sciencebuddies.org/cdn/Files/8285/11/safety-gear-pedestrian.jpg)
Figure 8. An observer sitting in the car rates how well he/she sees pedestrians standing at specific distances in front of a parked car. In the figure on the right, an assistant dressed in a dark color accompanies the person wearing the safety vest, being tested for visibility.
- Take data for one garment.
- Put on the garment.
- Walk back 25 m. Remember to be safe and stay near the edge of the street or on the sidewalk.
- Once you are there, provide the signal "Please evaluate."
- Wait until the assistant signals "I see you" or "I do not see you." If he/she replies "I do not see you" or you are at the last distance mark, go to step 3.f.
- Turn around and walk to the next distance mark. Once you have arrived, repeat steps 3.c.–3.e.
- Walk back to the car.
- Test all garments.
- Perform several trials.
- Leave no trash behind.
- Complete your data tables by adding 0's to any empty cells.
Analyzing Test Data
- Make a table with the average over different trials.
- Represent your average data graphically.
- Draw conclusions.
Ask an Expert
Global Goals
The United Nations Sustainable Development Goals (UNSDGs) are a blueprint to achieve a better and more sustainable future for all.
/-/https/www.sciencebuddies.org/cdn/Files/19746/5/E-WEB-Goal-03.png)
Variations
- In this science project, you studied bright yellow, fluorescent yellow, and retro-reflective material. You can also study how different colors impact visibility, such as black versus blue, green, red, orange, yellow, and white.
- You might have used new garments for your test. You can also study if and how heavy wear of safety vests reduces their power to increase visibility.
- In this science project, you did not consider the size of the garment. As a variation, you can study how the size of, for example the retro-reflective material, influences the visibility of a pedestrian.
- In this science project, you chose a street with very little ambient light. Can you find a way to repeat the test in a street lit with streetlights?
- In addition to measuring the visibility of pedestrians, you can make a survey to find out if pedestrians are aware of how they are perceived by a car driver. Would they tend to underestimate or overestimate their visibility at night? Would they know which garment increases their visibility, and by how much it increases it?
Careers
If you like this project, you might enjoy exploring these related careers:
/-/https/careerdiscovery.sciencebuddies.org/cdn/Files/1556/17/pexels-photo-4160235.jpg)
/-/https/careerdiscovery.sciencebuddies.org/cdn/Files/1365/18/iStock-1012791028.jpg)
/-/https/careerdiscovery.sciencebuddies.org/cdn/Files/1147/17/unsplash-fJebhGIP0P4.jpg)

/-/https/img.youtube.com/vi/gj-H_agfd6U/0.jpg)
/-/https/img.youtube.com/vi/iUwzIhfmV_E/0.jpg)
/-/https/img.youtube.com/vi/5W9KozawQVw/0.jpg)