Try Google's Science Journal App with Five Activities for Physics Exploration
With the free Science Journal app, students can start measuring and gathering data right away. We have suggestions for physics-based activities to get you and your students started!
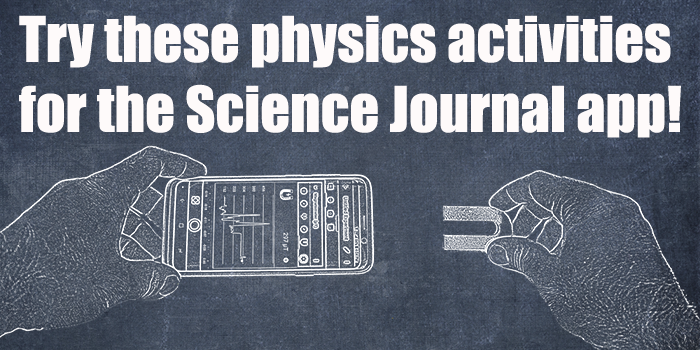
Try these physics activities for the Science Journal app!
Note: The Google Science Journal app is no longer available. Projects and Lesson Plans at Science Buddies that used the app have been revised to use other sensor apps for mobile devices that have similar functionality. The information below may still be valuable as a starting point for working with sensor-based apps, but please refer to your app for specific information about accessing and using sensor tools.
Google's free Science Journal app (for iOS or Android) gives students a full set of measuring and note taking tools for their STEM projects and everyday explorations. At Science Buddies, we have tutorials developed specifically for students to help them learn to use the app. We encourage teachers to have students bookmark the tutorials page—or use Google Classroom to assign it.
Try the Science Journal App!
If you are curious about Google's Science Journal app but not sure where to get started, we have suggestions! The Science Journal app is designed to be friendly and easy to use. Students can open the app, select a sensor, and immediately start watching data flow across the screen.
Our first "Try It!" post contained suggestions for using the Science Journal app to measure variables in the classroom (and surrounding) environment. In this post, we have suggestions for five physics-based things you and your students can try as you get to know the Science Journal app.
Try these Five Activities
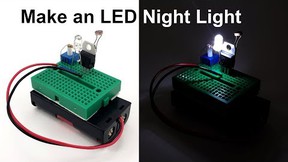
1. Compare Light Sources
Use the light sensor to compare the intensity of different light sources. For example, open the light sensor and take readings of different bulbs. (Tip: Have your students talk about what you will you need to do to get consistent readings that will allow you to compare between bulbs.) Your students may know that certain bulbs will be brighter than others, but using the Science Journal app, they can really explore this difference.
The image below shows sample snapshots (single readings) of light readings taken from different bulbs. These snapshots were taken on an Android device using the Ambient light sensor.
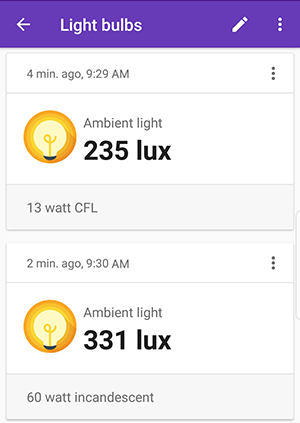
A screenshot of two snapshots from an ambient light sensor card in the Google Science Journal app experiment feed. The snapshots show values labeled from two different light sources. The top snapshot is labeled 13 watt CFL (235 lux) and the bottom snapshot is labeled 60 watt incandescent (331 lux).
Tip: Students might also compare the brightness of various environments at school. How bright is your classroom compared to the school library, cafeteria, gymnasium, auditorium, and outside? Have your students make guesses about how these locations rank in terms of light, and then put it to the test with the Science Journal app.
Important: Keep in mind that Science Journal on iOS and Android use different units to measure "light" (EV on iOS and lux on Android). You will only be able to directly compare data from devices that are using the same unit of measurement. For more information about using the light sensor, see Exploring Light with a Sensor App.
2. Move Towards and Away from Light
Use the light sensor to see firsthand how light intensity changes as you move away from (or toward) a light source. Set or prop your phone securely in a fixed location on a table or on the floor so that it is standing upright. (If necessary, one person can hold the phone in position.) Open the light sensor and start a recording. Using a flashlight (or the flashlight on another phone) as a light source, hold the light source close to the device to start. Steadily move the light source away from the light sensor. After moving the light source away, students can experiment to see how the graph changes as they bring the light source close again to the light sensor. What happens to light intensity as the distance changes between the light sensor and the light source?
The screenshot below shows a sample graph when a light source (the flashlight on another phone) was held close to the recording device at the start and slowly and steadily moved away from the phone, which was left in a fixed position.
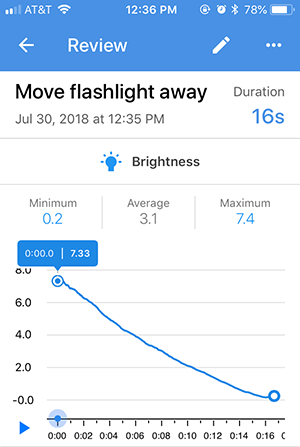
A screenshot of a flashlight recorded on a brightness sensor card in the Google Science Journal app. The graph steadily decreases in value as a flashlight is moved further from the brightness sensor.
3. Explore Acceleration and Deceleration
Use the accelerometer sensors to explore acceleration and deceleration. Using an accelerometer sensor, you can easily see both acceleration and deceleration when you move your phone. As an example, open the Accelerometer Y sensor, set the phone face up on a flat, smooth surface. Keeping the phone flat against the surface, slide the phone quickly up (the direction of the Y-axis), moving the phone only a short distance and not letting go. When you stop the phone, wait a second and then slowly slide it down again to the starting point. Repeat the movement, quickly sliding the phone up and then slowly back down again to return to the start. For each time you slide the phone up, you should see a positive spike on the graph as the phone accelerates (speeds up) and a negative spike as it decelerates (slows down).
Note: For added exploration, have students experiment with sliding the device all the way to the top and then all the way down (beyond the starting point) before returning to the starting point. What differences appear on the graph? You can also do this activity using the Accelerometer X sensor and change the direction of the slide movement to match the X-axis. For more information about using the accelerometer sensors, see Exploring Acceleration with a Sensor App.
The screenshot below shows a sample graph from the activity described using the Accelerometer Y sensor.
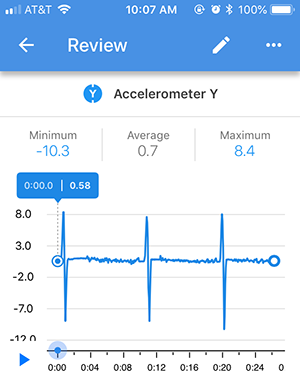
A screenshot of a sliding phone recorded on an accelerometer Y sensor card in the Google Science Journal app. Spikes appear in the graph that sharply increase then sharply decrease as a phone slides up then quickly comes to a stop before returning to its original position.
4. Explore Magnetism
Use the magnetometer to see how it responds to magnetic fields. With the magnetometer sensor open, lay the phone face up on a flat surface. Using a small household magnet, hold the magnet in front of the phone and slowly bring it closer to the front/top end of the phone. You should see the reading increase on the graph as the magnet comes closer. If you move the magnet toward the phone and then away again, and repeat, you will see the peaks on the graph as the magnet gets closer to the phone. Using the magnetometer sensor, students can explore an assortment of metal objects to see which ones are magnetic.
The screenshot below shows a sample graph from raising and lowering a small magnet near the top of the phone.
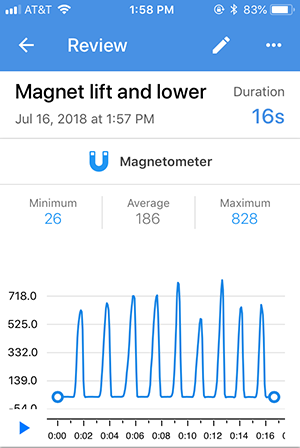
A screenshot of a magnetic field recorded on a magnetometer sensor card in the Google Science Journal app. Spikes appear in the graph as a magnet is briefly moved closer to a phone and then moved away from it.
Note: You only need a relatively weak household magnet to try this exercise.
5. Observe the Direction of Gravity
Use the accelerometer to observe the direction of gravity. Mobile apps often detect tilting of the device and use this information to control behavior (or game play) in the app. For example, steering in a racing game may depend upon tilting the device to control the direction of the in-game movement. To see how your device registers gravity, you can use the X, Y, or Z accelerometer. For demonstration, open the Accelerometer Z sensor. Hold the phone face-up and flat horizontally, with your hands at each end. With the phone perfectly flat, you should see readings approximately 9.8 m/s2. The Z-axis extends outward from the face of the device. With the phone horizontal and flat, the Accelerometer Z sensor reflects the pull of gravity. Start a recording on the Accelerometer Z sensor and slowly rotate the phone so that you completely turn it over and keep rotating it until you reach your starting, face-up, orientation. Stop the recording. Your graph should show peaks that are close to both positive and negative 9.8 m/s2, corresponding to the phone being face up and face down, respectively. (For more information about using the accelerometer sensors, see Exploring Acceleration with a Sensor App.)
The screenshot below shows a sample graph from this activity with the Accelerometer Z sensor.
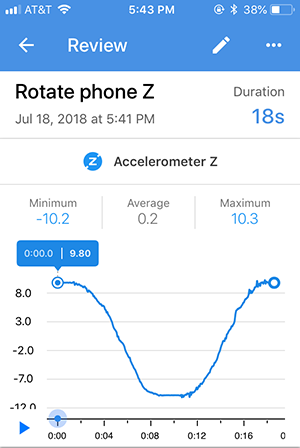
A screenshot showing acceleration data from a phone that is flipped over using the accelerometer Z sensor card in the Google Science Journal app. The graph shows a gradual decrease and then increase in acceleration as a phone is rotated from face-up to face-down.
Note: For added exploration, have students do this same activity but start with the phone face down. How does the graph differ after one complete revolution? For more information about using the accelerometer sensors, see Exploring Acceleration with a Sensor App.
Use the Science Journal App with Your Students
The Science Journal app makes it easy to explore the world around you and see science concepts in action. With the app installed on their devices, you can do activities like the ones described above with students.
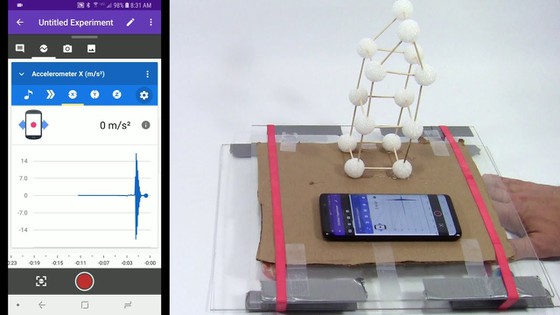
The video below also highlights six physics-based activities that help show the range of exploration available with Science Journal app.
See Try Google's Science Journal App with Five STEM Activities for the Classroom for additional quick and easy explorations students can do with the Science Journal app in the classroom or for additional practice using the app.
Science Buddies has independent project ideas for students that work with the app as well as free Lesson Plans for educators that take advantage of the app as part of in-class exploration.
Our tutorial series for Google's Science Journal app is a series of guided walkthroughs developed specifically for students to help them learn to use the app. We encourage educators to have students bookmark the tutorials page—or use Google Classroom to assign it. We recommend that all students using the app read posts 1 and 2. Additional posts are available to help students who will be using specific sensors for their projects.
- Get Started with a Sensor App (#1)
- Sensor Savvy with a Mobile Phone App (#2)
- View all posts in the Science Journal app tutorial series
- Try Google's Science Journal App with Five STEM Activities for the Classroom
- Science Buddies and Google's Science Journal App (resource for educators)
- Fun Physics with Google's Science Journal app
- Science Buddies Project Ideas that use the Science Journal app
Download the App to Get Started!
The Google Science Journal app is no longer available. Download links have been removed.

Try these physics activities for the Science Journal App!
Categories:
You Might Also Enjoy These Related Posts:
- Teachers Develop Exciting New Lessons with Us for Science Journal
- Your Science Project Data Wherever You Are
- Exploring Pitch with a Sensor App
- Try Google's Science Journal App with Six Activities for Chemistry Exploration
- Try Google's Science Journal App with Five Activities for Physics Exploration
- Try Google's Science Journal App with Five STEM Activities for the Classroom
- Exploring Acceleration with a Sensor App
- Learn to Use Google's Science Journal App