Sensor Savvy with a Mobile Phone App
The second installment in our "how-to" series for using Google's Science Journal app for science class focuses on using sensors to monitor and record data.
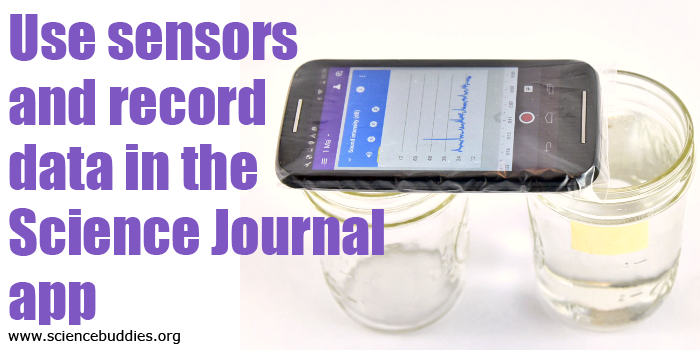
Use sensors and record data in the Science Journal app. www.sciencebuddies.org
Note: The Google Science Journal app is no longer available. Projects and Lesson Plans at Science Buddies that used the app have been revised to use other sensor apps for mobile devices that have similar functionality. The information below may still be valuable as a starting point for working with sensor-based apps, but please refer to your app for specific information about accessing and using sensor tools.
A Suite of Sensors
Google's free Science Journal app is a robust tool for students working on science projects and exploring the world around them. The app, available for both iOS and Android, uses sensors on the phone or mobile device to take real-time data measurements related to acceleration, sound, light, and more. At the press of a button, you can access a range of sensors and begin recording data and logging experiment notes and observations.
Science Buddies is proud to be working in partnership with Google to develop projects and activities to support student exploration using the app. Twenty Science Buddies projects have been updated to work with the app's ability to use sensors on the phone or device.
For an introduction to the interface of the Science Journal app, see the first post in this series: Get Started with a Sensor App.
In this post, we cover the use of sensors in the app and how to record data.
Working with Sensors
To begin working with sensors in the Science Journal app, tap the sensor icon (the circle with the wavy line across the middle) on the gray toolbar. Tapping the sensor tool opens a sensor card. Scroll the sensor bar horizontally to find the sensor you want to use. Tap any sensor to activate it.
For example, the image below shows a sensor card on which the Magnetometer sensor is active. The active sensor is indicated by the name of the sensor in the top bar and by the underlined icon in the second bar. (Note: The available sensors bar can be opened or closed by tapping the arrow next to the sensor name in the top bar of the sensor card.) Tap a different sensor icon to switch to a different sensor.
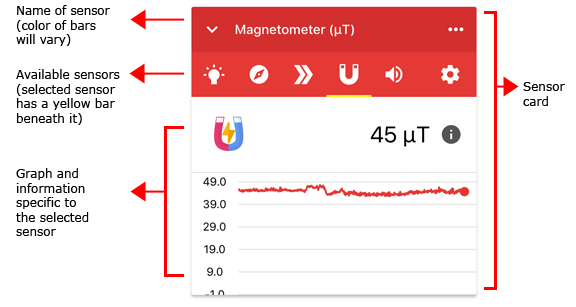
A cropped screenshot of a magnetometer sensor card in the Google Science Journal app. The sensor card is labeled and shows the name of the sensor at the top. Below the name are icons to switch between sensors and below that is a graph for the sensor (measured in micro tesla).
(Note: In the image above, the sensor card bars are shown in red. Additional sensor cards will use other colors.)
Sound, Light, Acceleration, and More
The following sensors may be available on your phone or device:
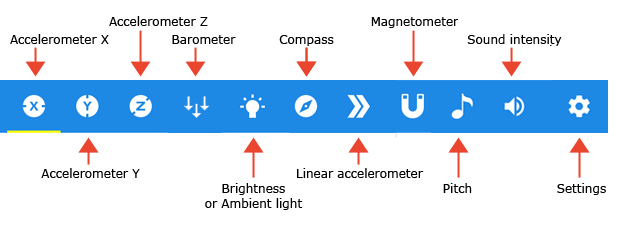
A cropped screenshot of the sensor card icons with labels in the Google Science Journal app. From left-to-right the sensors are pictured and labeled: circle with an X (accelerometer X), circle with a Y (accelerometer Y, circle with a Z (accelerometer Z), three downward arrows (barometer), a lightbulb (brightness or ambient light), a compass (compass), two right facing arrows (linear accelerometer), a U-shaped magnet (magnetometer), a musical note (pitch), a speaker (sound intensity) and a gear (settings).
(Note: The image above shows all sensors at one time. On your device, scroll the bar horizontally to find and select the sensor you need.)
The sensors:
- Accelerometer X: the acceleration of the phone to the left and right in meters per second squared (m/s2)
- Accelerometer Y: the acceleration of the phone forward and back in meters per second squared (m/s2)
- Accelerometer Z: the acceleration of the phone up and down in meters per second squared (m/s2)
- Brightness (iOS) or Ambient light (Android): the amount of light detected by the front-facing camera, measured in Exposure Value (EV) on iOS, or by the ambient light sensor, measured in lux on Android
- Compass: the orientation of the phone compared to the Earth's magnetic field, measured in degrees
- Linear accelerometer: total acceleration of the phone, excluding gravity, in meters per second squared (m/s2)
- Magnetometer: the strength of the geomagnetic field in microtesla (μT)
- Sound intensity: the intensity of sound reaching the camera's microphone, measured in decibels (dB)
- Barometer: the atmospheric pressure measured in hectopascals (hPa)
- Pitch: the pitch of the sound reaching the sound sensor or microphone, measured in hertz (Hz)
Tip: Tapping the "i" icon next to the current reading on a sensor card provides additional information about the sensor.
Using Sensors
Once a sensor card is open for the sensor you want to use, you can make observations and record data. The app works similarly to make observations for each type of sensor. A sample sensor card is shown below:
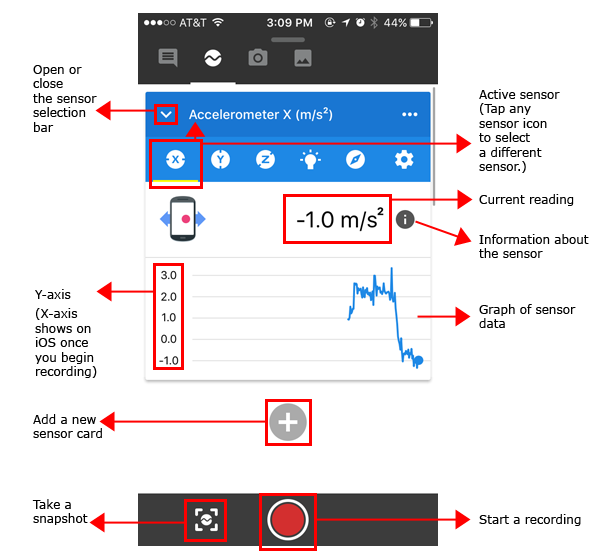
A screenshot of an accelerometer X sensor card in the Google Science Journal app. The sensor card is labeled and shows the name of the sensor at the top. Below the name are icons to switch between sensors and below that is a graph for the sensor (measured in meters per second squared). Above the graph an icon of an vertical phone shows the direction of the axis with arrows pointing left and right. A gray plus sign beneath the sensor card allows additional sensor cards to be added and a bar at the bottom of the screen has buttons to take a snapshot and to record the sensor data.
Note: The screenshot above is from an iOS device. The x-axis in the Science Journal app represents time. The x-axis is visible on Android when a sensor card is open. On iOS, the x-axis does not show until you begin recording.
You will notice other minor differences in the interface between iOS and Android. On an Android device, the title of the experiment is shown at the top of the screen, and you will need to scroll to access the button at the bottom to "add" a new sensor card. The image below shows a sample Accelerometer X sensor card on both platforms, iOS on the left and Android on the right.
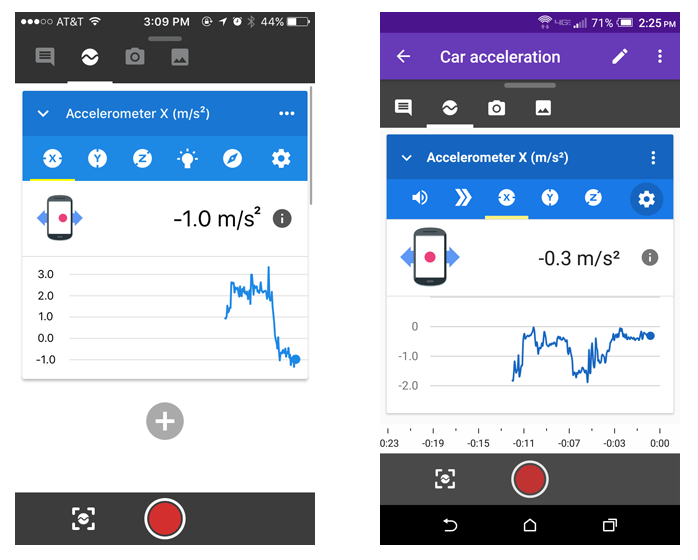
Two screenshots show an accelerometer X sensor card in the Google Science Journal app on an iOS device (left) and Android device (right). On Android devices the name of the experiment appears above the sensor card. On an iOS device the gray plus sign to add a sensor card is visible without having to scroll down.
Tip: Remember, after selecting a sensor, you can slide the gray toolbar up, as shown in the screenshots above, to make the sensor card use the full screen. For additional information see the first post in this series.
Gathering Sensor Data
When viewing open sensor cards, there are two important icons at the bottom of the screen: the "sensor" icon in a box (on the left) and a "record" button. These buttons enable you to take a snapshot or start a recording, as described below.
Take a Snapshot
Tapping the sensor icon in the box takes a snapshot of the sensor's reading at that time and saves it in the experiment feed. The snapshot records a single reading (a single data point) from the sensor (not a graph).
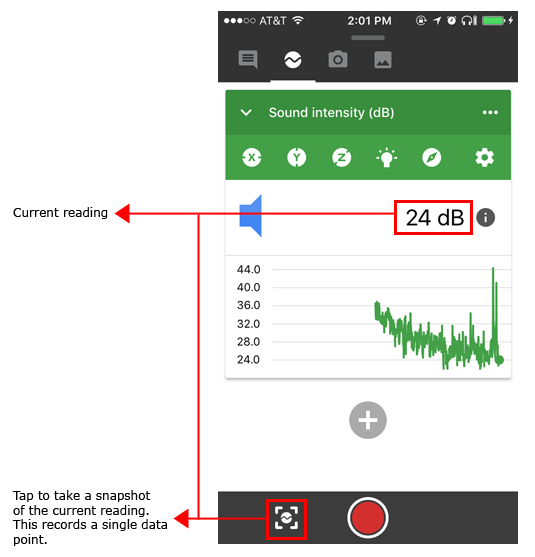
A screenshot of a sound intensity sensor card in the Google Science Journal app. The sensor card is labeled and shows the name of the sensor at the top. Below the name are icons to switch between sensors and below that is a graph for the sensor (measured in decibels). A gray plus sign beneath the sensor card allows additional sensor cards to be added and a bar at the bottom of the screen has buttons to take a snapshot and to record the sensor data.
When you open a snapshot in the experiment feed, you see the "Snapshot details"—the recorded value, the date and time of the snapshot, and any description you enter. No graph is shown. The screenshot below shows a snapshot recording from a single sensor.
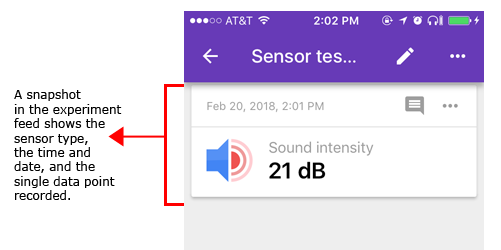
A cropped screenshot of a snapshot taken from a sound intensity sensor card in the Google Science Journal app. The snapshot shows a single value (21 dB in this example) and the date and time for when the snapshot was recorded. The snapshot also has a sensor name and icon visible for easy identification in the experiment feed.
(Note: All open sensor cards are recorded when you take a snapshot reading. We will be covering working with multiple sensors in more detail in another post.)
Make a Recording
Tapping the record button begins a live recording of sensor data. While recording, the record button changes to a "stop recording" button (a circle with a square in the middle). The image below shows a recording in progress.
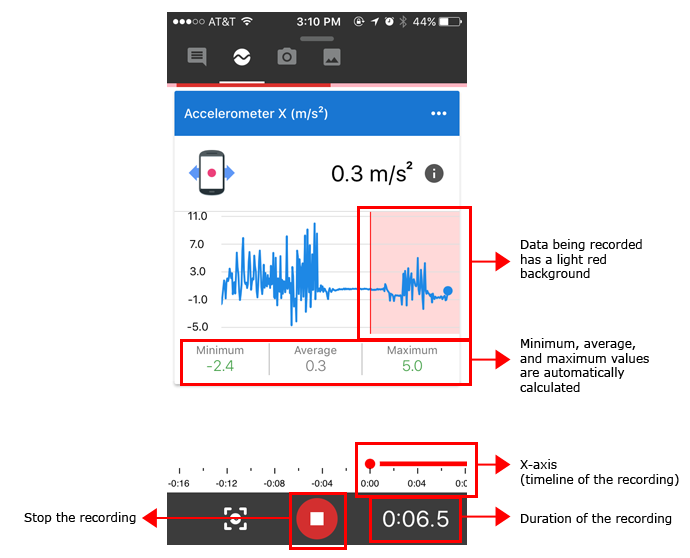
A screenshot of an active recording for an accelerometer X sensor card in the Google Science Journal app. The sensor card is labeled and shows the name of the sensor at the top. A red section, showing what is being recorded, is outlined on the graph for the sensor (measured in meters per second squared). Minimum, average and maximum values of the recorded section appear beneath the graph. There is also a timeline and timer at the bottom of the screen to keep track of the time of the recordings.
(Note: the color and appearance of icons and buttons like the "stop recording" button may differ between iOS and Android.)
As shown above, when the app is recording, the duration of the recording is shown in the lower right of the screen. The current reading is shown to the right of the sensor icon (above the graph). The "minimum," "average," and "maximum" values are calculated dynamically (as the recording is happening) and shown on the screen. The red bar along the x-axis shows the timeline of the recording, the blue line shows the data from the sensor, and the data being recorded is shown with a light red background.
To stop recording, tap the "stop recording" button. The recording is saved to the experiment feed (as a graph) with the time and date.
If you exit the app while the app is recording, the recording stops. If your phone goes to sleep while you are recording, the recording stops. If you need to record something that will take longer than your device's Auto-Lock (iOS) or Sleep (Android) setting, you will need to change these settings on the device.
Tip: If you are working with long recordings, you may need to set your phone or device's screen to always-on.)
(Note: All open sensor cards are recorded when a recording is started. We will be covering working with multiple sensors in more detail in another post.)
Review a Recording
All snapshots and recordings are stored in the experiment feed. By default, recordings are named sequentially (Recording 1, Recording 2, etc.). (You can rename any observation.) Tap a recording from the experiment feed to view the data recorded by the sensor. A sample recording is shown below:
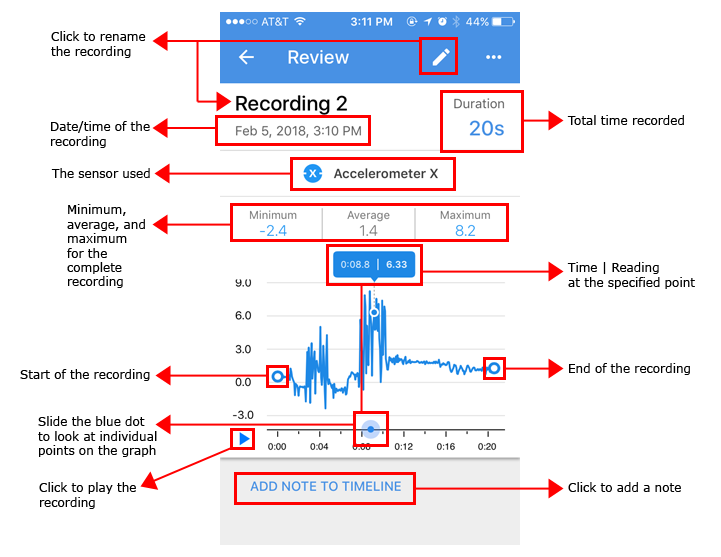
A screenshot of a recording review for an accelerometer X sensor card in the Google Science Journal app. A pencil at the top of the screen allows the user to rename the recording. The review shows the recording title, duration, date and time, and the type of sensor card used to record at the top of the screen. Below that is a graph of the recorded data with minimum, average and maximum values shown above the graph and a marker on the graph that shows data points at specific times on the graph. A play button and link to add a note to the timeline are located on the bottom of the screen.
Tip: The "minimum," "average," and "maximum" values for the recording are calculated automatically by the Science Journal app. Touching any of these values will show the positions of all calculated values on the graph.
When viewing a graph from a recording, the x-axis is time in m:ss. The y-axis units depend on the sensor that was used. When a recording is opened, the complete timeline is shown on the screen (compressed to fit). The graph can be zoomed in or out using standard pinch to zoom gestures (e.g., using two fingers and dragging them apart or together horizontally to zoom in or out). For long recordings, the entire graph can be moved horizontally by putting your finger on the graph and sliding either direction.
You can use the blue "play" arrow at the bottom of the graph to play the recording. This makes the data audible by playing a pitch that represents the magnitude of the data value. Playback can be paused at any time by pressing the pause button (two vertical bars).
During playback, the small blue circle representing the current position on the graph will visibly move along the x-axis. A small colored circle on the graph will mark the current data, and the x and y values at that point on the graph will be shown in a box at the top of the graph (see image above). You can also manually move the blue dot to a specific spot on the graph when the playback is paused. This is useful if you need to know the exact value for a specific point on the graph (for example, a peak or a valley or the value at a specific time) instead of the average over the whole recording.
(Note: The color of the data on the graph matches the color of the sensor card at the time of recording; some tools, like the blue dot for the current point on the x-axis, stay the same regardless of the other colors.)
Cropping and Exporting Data
Using the three-dot menu on a recording, you can access tools to crop, share, archive, or delete the recording. Access to some of these features is available only to users over age 13. (You are asked to enter your age when you first set up the app.)
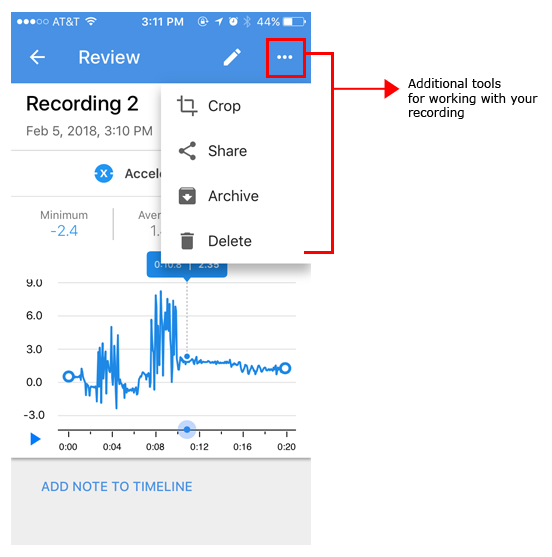
A screenshot of a drop-down menu for a recording review in the Google Science Journal app shows options that can be found by pressing on a button with three dots at the top-right of the screen. The are additional links to a crop tool, sharing options, archive and an option to delete the recording.
(Note: The screenshot above shows three-dot menu options for a recording on iOS. On Android, other options may also be available.)
Crop
Cropping a recording allows you to trim the recording. For example, you may need to remove data at the beginning or end of a trial that reflects handling (moving, positioning, etc.) the device. To crop the graph, tap the three-dot icon and select the crop option. Use the blue slider handles on the graph to drag the start and end points to the desired location. Then tap the check mark in the top right corner.
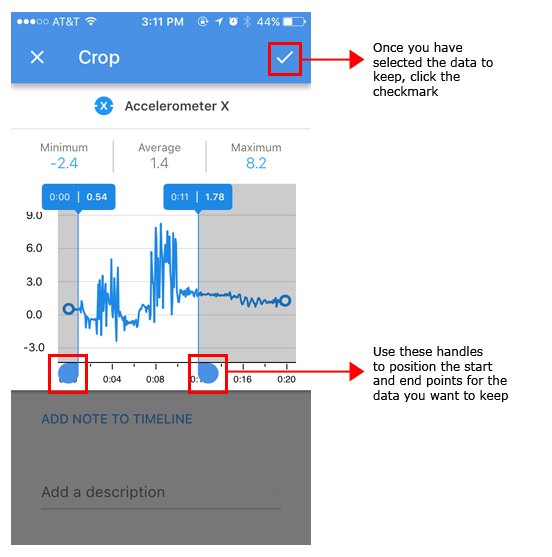
A screenshot of a recording being cropped in the Google Science Journal app. When cropping a recording there are two markers that appear on a timeline below a graph that are used to set start and end points for the crop. Data that will be removed is highlighted in gray, data between the two markers on the timeline will be kept. A checkmark in the top-right of the screen will save the changes.
Warning: There is currently no undo feature. Be careful when cropping!
After cropping, the recording will show only the selected data. The graph on the experiment log, the duration, and the minimum, average, and maximum values will be automatically updated. (Note: The x-axis of a recording always begins at 0:00. After cropping, the data retained will begin at 0:00.)
Share
The share function allows you to send or save a copy of the data outside of the app. You must be age 13 or older to share (or export) data.
To export data, open a recording, tap the three-dot menu, and tap the "Share" option. Check the "Relative time" box option to export time data from your recording starting at zero (when you pressed the record button). (If this option is not checked, the time data will be presented in Unix time (elapsed time since Jan 1, 1970).) Data can be shared using any of the share mechanisms on the device (e.g., send as a text message, email, Save to Drive, etc.). The following screenshots show the steps to export data.
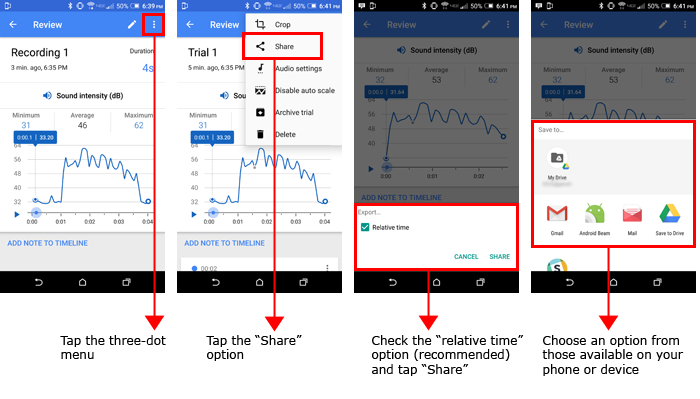
A series of four screenshots show a recording being shared from the Google Science Journal app. First the menu (three dots in the top-right of the recording review screen) is pressed. Then a share link is pressed from the resulting drop-down menu. An option for relative time is checked and then a sharing option is selected from a list of icons for sharing options such as Google Drive and email.
Data is exported as a comma-separated values (CSV) file that can be opened in a spreadsheet program. When you open a file exported from the Science Journal app, the first column contains the time data in milliseconds. The second column contains the sensor value. The unit for the sensor value depends on which sensor was used.
Tip: You can divide the time data by 1,000 to convert to seconds.
More to Come
In the next post in this tutorial series, we begin looking more closely at some of the individual sensors students can use in the Science Journal app with Science Buddies projects.
See also these posts in this series and other Science Journal app resources at Science Buddies:
- Get Started with Google's Science Journal App
- Exploring Sound Intensity with a Sensor App
- Exploring Light with a Sensor App
- Exploring Acceleration with a Sensor App
- Exploring Pitch with a Sensor App
- View all posts in this series
- Science Buddies and Google's Science Journal App (resource for educators)
- Science Buddies Project Ideas that use the Science Journal app
Download the App to Get Started!
The Google Science Journal app is no longer available. Download links have been removed.
Use sensors and record data in the Science Journal app.
Categories:
You Might Also Enjoy These Related Posts:
- Teachers Develop Exciting New Lessons with Us for Science Journal
- Your Science Project Data Wherever You Are
- Exploring Pitch with a Sensor App
- Try Google's Science Journal App with Six Activities for Chemistry Exploration
- Try Google's Science Journal App with Five Activities for Physics Exploration
- Try Google's Science Journal App with Five STEM Activities for the Classroom
- Exploring Acceleration with a Sensor App
- Learn to Use Google's Science Journal App