Exploring Pitch with a Sensor App
The next in our "how-to" series for using Google's Science Journal app for science class focuses on the pitch sensor.

Experiment with the pitch sensor in the Science Journal app. www.sciencebuddies.org
Note: The Google Science Journal app is no longer available. Projects and Lesson Plans at Science Buddies that used the app have been revised to use other sensor apps for mobile devices that have similar functionality. The information below may still be valuable as a starting point for working with sensor-based apps, but please refer to your app for specific information about accessing and using sensor tools.
Google's free Science Journal app lets you use sensors on your phone or mobile device (for iOS or Android) to observe and record data as part of an experiment or exploration of the world around you.
For an introduction to the Science Journal app and how to work with sensors in the app, see other posts in this series:
In this post, learn more about using the pitch sensor in the Science Journal app.
What is Pitch?
Have you ever heard someone talk about a musician having "perfect pitch" or heard judges at a singing competition tell someone that a performance was "pitchy"? Someone with perfect (or absolute) pitch is able to accurately reproduce a note or tone without a reference. When a song is dubbed "pitchy," on the other hand, you know that the musician was not hitting all of the notes exactly (or was "off key" in places). When we listen to music, we talk about pitch in terms of how we perceive what we hear, but pitch is actually directly related to the physics of sound waves.
The frequency of a sound wave creates what we hear or perceive as pitch. The frequency of a sound wave is a measurement of how fast the sound wave vibrates. As shown in the diagram below, the more quickly a sound wave vibrates (the shorter the period), the higher the pitch; slower vibration (longer period) results in a lower pitch. The frequency or pitch of sound is measured in Hertz (Hz). One Hz is equal to one vibration cycle per second. (In the diagram below, one sample vibration cycle or "period" is marked for each sound wave.)
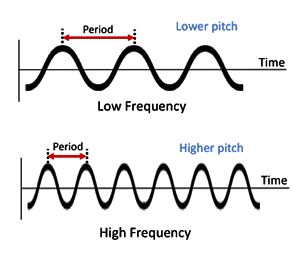
Two example graphs show the differences between a low frequency wave and a high frequency wave. The low frequency wave (above) has a longer period and lower pitch than the high frequency wave (below).
In general, humans are said to hear sounds with frequencies from 20 Hz to 20 kHz (kilohertz). (This range may vary with age, which is a good question students might explore!) Sounds we commonly hear fall within this general spectrum of sound frequency. Everything we hear is made of sound waves and, therefore, has a pitch. Human speech, for example, may range from 85 Hz to 255 Hz, with specific ranges common to males versus females. (Again, these differences can be explored by students using the app.) Sirens and alarms, like police sirens, often have a high frequency, sometimes in the range of 1 kHz to 3 kHz. In music, 440 Hz (A440) is often used as a standard tuning frequency. (If you are interested in music theory, you may want to further explore the relationship between pitch and musical scales.)
It is important to note that humans only hear sounds within a certain frequency range, but there are sounds outside of that range—and other species have more sensitive hearing and can detect sounds at higher frequencies. Dog whistles are a good example of a sound at a frequency (23 kHz to 54 kHz) that humans cannot hear, but dogs can. As you can see from these examples, familiar sounds fall within a wide range of frequencies. Once you start using the app to measure pitch, you may find many exciting ways to explore and compare pitch samples.
What is the Pitch Sensor?
The Science Journal app uses the microphone that is built into your phone or mobile device to measure the pitch of sound. The app contains separate sensors to measure sound intensity and pitch. Both of these sensors use the microphone, and both pitch and sound intensity relate to what we hear (or what the microphone hears). But they are very different measurements. The sound intensity sensor is used to measure the intensity of sound (which we may perceive as "loudness"), and it can measure low levels of sound or ambient noise. The pitch sensor measures the frequency of sound, and it is often used to measure the frequency of sustained sounds like humming or singing rather than sounds that are shorter in duration.
Tip: For more information about pitch, click the "i" next to the sensor reading on the pitch sensor card.
Use the Pitch Sensor in an Experiment
To measure or monitor pitch, open the app and start an experiment (or open an existing experiment). Open the sensor tools by tapping the sensor icon on the gray toolbar and select the pitch icon (looks like a musical note) from the colored bar showing available sensors. This will open a pitch sensor card.
Tip: Remember that you may need to slide the sensor toolbar left or right to find the sensor you want to use. If you need more information on how to navigate and interact with the app, read posts 1 and 2 in this tutorial series.
Reminder: Keep in mind that when measuring pitch, other sounds in the area may also be picked up by the app. It is important to do your experiment in a quiet location.
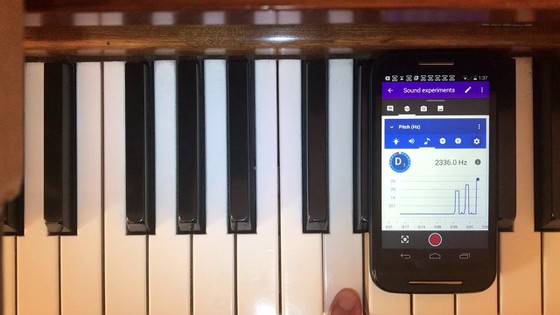
The image below shows a sample pitch sensor card. No data is being recorded in the card shown, but the sensor is actively monitoring sound reaching the microphone and measuring pitch. The graph on the sensor card shows the readings the sensor is making. (Note: A sensor begins reading as soon as a sensor card is opened, but the app only records data when you start a recording or take a snapshot reading.) When viewing pitch sensor data, the units on the y-axis are in Hz. The x-axis represents time in mm:ss. (Note: Remember that the x-axis does not show on iOS until a recording begins.)
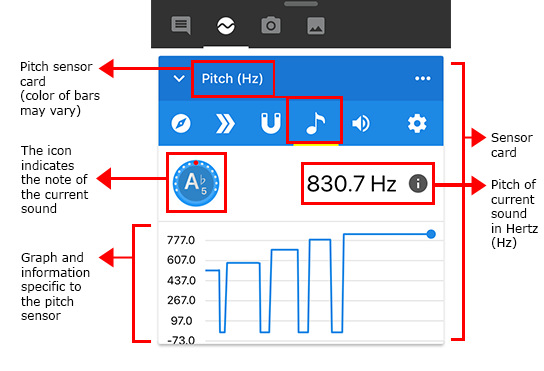
A screenshot of a pitch sensor card in the Google Science Journal app. The sensor card is labeled and shows the name of the sensor at the top. Below the name are icons to switch between sensors and below that is a graph for the sensor (measured in Hz). Above the graph is an icon that shows the note of the current sound next to the pitch value of the current sound.
With a pitch sensor card open, say something out loud, and you will see the pitch of the sound on the graph. Try humming or singing instead. Experiment with single notes and with varied notes (moving your voice up or down a musical scale, for example). Your notes do not need to be perfect! As you hum or sing, you will see the changes in the pitch of your sounds show on the graph.
As shown on the diagram above, the pitch sensor card also has a circular pitch icon that identifies the music note associated with the current pitch. This icon works like a tuner. It shows a dash ( - ) when there is no sound, but when sound is detected, the icon shows the closest musical note (by letter) and how flat (low) or sharp (high) the sound is. The red dot on the outer ring of the icon indicates how close the pitch is to the natural note (which is right in the middle of the ring).
Recording Pitch Sensor Data
Using the Science Journal app, you can take snapshots of pitch readings or record changes in pitch over time. (Note: These steps are explained in more detail in the Sensor Savvy with a Mobile Phone App post.)
The image below shows how snapshots and recordings from the pitch sensor appear in the Science Journal experiment feed. Tapping a snapshot or a recording opens the observation so that you can view additional details (or access additional features like crop and export for recordings).
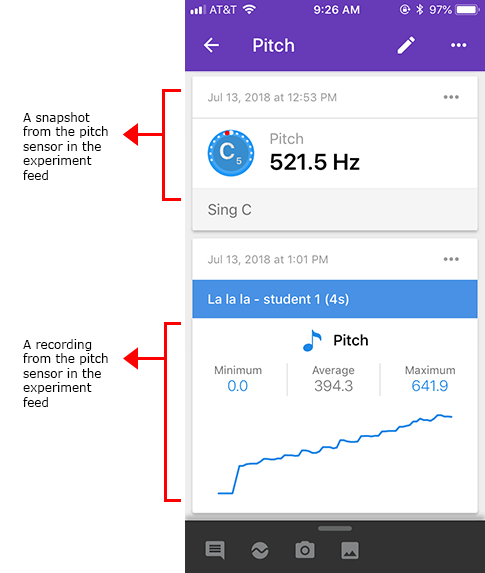
A screenshot of a snapshot and recording taken from a pitch sensor card in the Google Science Journal app experiment feed. The snapshot shows a note and pitch value (C and 521.5 Hz in this example), label for the sensor card and a date and time. The recording shows a graph of the recording, the recording title, date and time, label for the sensor card and minimum, average and maximum values of the graph.
Reviewing a Recording
When you open a recording from the experiment feed, you can review the graph in more detail. A sample recording from the pitch sensor is shown below.
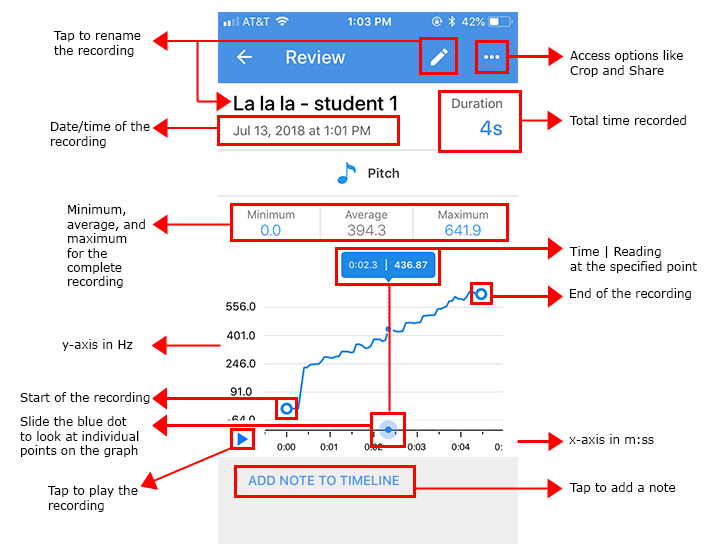
A screenshot of a recording review for a pitch sensor card in the Google Science Journal app. A pencil at the top of the screen allows the user to rename the recording. Three dots in the top-right of the screen can be pressed to access additional tools such as cropping and sharing. The review shows the recording title, duration, date and time, and the type of sensor card used to record at the top of the screen. Below that is a graph of the recorded data with minimum, average and maximum values shown above the graph and a marker on the graph that shows data points at specific times on the graph. A play button and link to add a note to the timeline are located on the bottom of the screen.
Before using your data, you may need to crop your graph to remove additional noise at the beginning or end. For example, you may need to remove noise that occurred while handling your device or noise that occurred before the sound you were measuring started. Crop and Share (export) options can be accessed by tapping the three-dot menu in the top corner of the recording.
Tip: Information about reviewing a recording and working with crop and share options is covered in more detail in this post.
Pay Attention to the Y-axis!
When working with the pitch sensor, it is especially important to notice the scale of the y-axis values when interpreting and comparing graphs. The sample graphs below were recorded with two different students singing "la, la, la." The graphs look similar, but if you look closely at the y-axis and the average and maximum values, the data is very different.
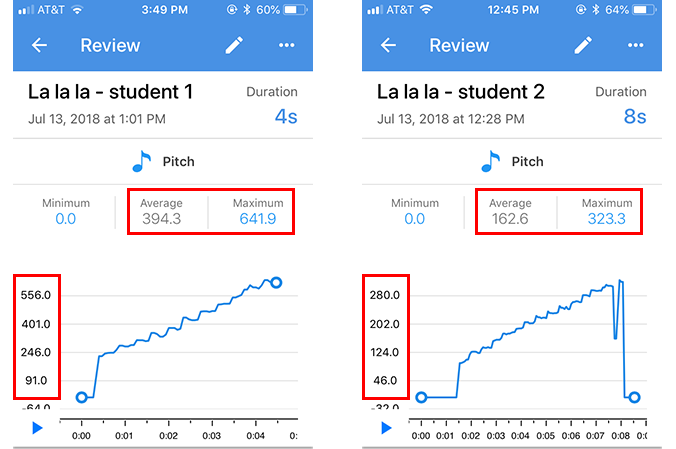
Two screenshots show recordings of students singing on a pitch sensor card in the Google Science Journal app. The graph on the left shows a very high pitch that averages 394.3 Hz and has a maximum of 641.9 Hz. The graph on the right shows a very low pitch that averages 162.6 Hz and has a maximum of 323.3 Hz.
Note: Graphs in the Science Journal app automatically use an auto-zoom feature, so when you view a graph, the y-axis might not start at zero.
Try the Pitch Sensor
To see the pitch sensor in action in Science Journal, try the following simple activity. In a quiet room, watch the pitch sensor graph as you sing "la, la, la, la, la" near the device. You will see the changes in the pitch of your voice reflected on the graph. Experiment to see if you can sing "la, la, la, la, la" starting at one note and gradually going higher as you move up the scale. Can you create a smooth line? (You may find singing "Do, Re, Mi" is easier.) After going up the scale, start at a high note and sing "la, la, la," gradually going down the scale. How does the line on the graph change?
The screenshot below shows a "Do, Re, Mi" test being recorded in the Science Journal app. (Note: You can tell the sensor is recording in this image because the background is light red during recording.)
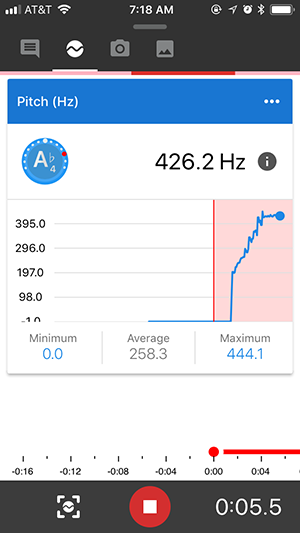
A screenshot of an active recording of someone singing on a pitch sensor card in the Google Science Journal app. The sensor card is labeled and shows the name of the sensor at the top. A red section, showing what is being recorded, is outlined on the graph for the sensor (measured in Hz). Minimum, average and maximum values of the recorded section appear beneath the graph. There is also a timeline and timer at the bottom of the screen to keep track of the time of the recordings.
Another way to see how the pitch sensor works is to use it with recordings of various pitches or with tone generator apps and tools. For example, using a series of pitch tuning videos (one pitch per video), we recorded different tuning pitches with the Science Journal app. In the screenshot below of our recording, you can clearly see increases in pitch that matched different tuning videos. When each video was started, the pitch on the graph immediately jumped from 0 Hz to the Hz level for the natural note of the tuning video. (Compare this graph to our student's "Do, Re, Mi" sample above.)
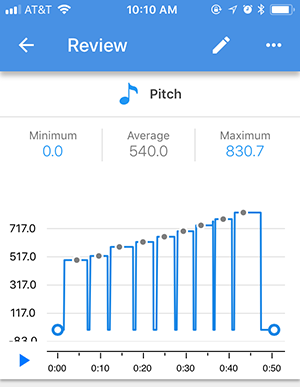
A screenshot of a recording review for a pitch sensor card in the Google Science Journal app. The graph shows 9 gray dots which mark points in the recording where snapshots were taken.
Note: In the screenshot above, the gray dots represent points at which we took a "snapshot" in the app during the recording. When you take snapshots while recording, they will be recorded as points on the graph this way. The corresponding snapshots appear beneath the recorded graph, as shown below. In this example, the first snapshot was of tuning note B (493.88 Hz). As you can see, the Science Journal app snapshot recorded exactly that Hz (rounded up).
Tip: The pitch icon (that shows the musical note by letter) only shows when the sensor card is monitoring sound. When you review a recording later, you will not be able to see the corresponding musical notes (by letter) for various points on the graph. You can consult musical note/frequency charts online, or you can take snapshots during your recording to make it easy to review the musical notes later.
Experiment with the Pitch Sensor in Class
The following Lesson Plan at Science Buddies is for a classroom activity that uses the pitch sensor:
- Perfect Pitches with a Rubber Band Guitar (grades 6-8)
Do More with the Pitch Sensor
Based on the examples covered in this tutorial, you may have lots of ideas for ways to explore, record, and compare pitch. Can you use the Science Journal app to evaluate the pitch of favorite songs? Try it out! What variables will make a difference in how accurate your recordings are? Using a streaming music service or online videos of songs makes it easy to pull up songs to test. What role do the instruments play? How will an a cappella (voice only) version of a song compare to the version that includes instruments? How do favorite vocalists compare in terms of pitch? Can a change in pitch make a wakeup alarm more effective? What deductions can you make that you might explore further? Keeping in mind the standard frequency range of human hearing, you might find ways to use a sound sample video like this one as part of your exploration. (Keep in mind that you may not be able to hear certain frequencies, depending on your device and speakers. Do not turn your speaker up.)
Get creative about how you explore pitch. Have you ever listened to a tea kettle whistle? What pitch is your doorbell? You might know that you can tap a glass with a spoon (or run your wet finger around the rim) and generate a sound. With the pitch sensor, you can see the pitch of the sound and experiment to see how the pitch changes when you fill the glass with varying amounts of water.
Note: After thinking about pitch and different sounds, you might be curious about the frequency of white noise videos or devices, but you may find that the Science Journal app doesn't pick up noises at very low frequencies, so you may not be able to register white noise samples with the app. Too bad! Keep in mind that if you are using recorded materials, in order to hear or test materials, your speakers have to be able to play those materials; similarly, the app can only measure frequencies that your phone's microphone can pick up.
The video below highlights other experiments you can do with the pitch sensor.
The Science Journal App Series
See other posts in this tutorial series and additional Science Journal app resources at Science Buddies:
- Get Started with a Sensor App
- Sensor Savvy with a Mobile Phone App
- Exploring Sound Intensity with a Sensor App
- Exploring Light with a Sensor App
- Exploring Acceleration with a Sensor App
- View all posts in this series
- Science Buddies and Google's Science Journal App (resource for educators)
- Science Buddies Project Ideas that use the Science Journal app
Download the App to Get Started!
The Google Science Journal app is no longer available. Download links have been removed.
Categories:
You Might Also Enjoy These Related Posts:
- Teachers Develop Exciting New Lessons with Us for Science Journal
- Your Science Project Data Wherever You Are
- Exploring Pitch with a Sensor App
- Try Google's Science Journal App with Six Activities for Chemistry Exploration
- Try Google's Science Journal App with Five Activities for Physics Exploration
- Try Google's Science Journal App with Five STEM Activities for the Classroom
- Exploring Acceleration with a Sensor App
- Learn to Use Google's Science Journal App